Immigrants from Latin America vs Immigrants from Hungary 9th Grade
COMPARE
Immigrants from Latin America
Immigrants from Hungary
9th Grade
9th Grade Comparison
Immigrants from Latin America
Immigrants from Hungary
90.4%
9TH GRADE
0.0/ 100
METRIC RATING
337th/ 347
METRIC RANK
95.4%
9TH GRADE
94.2/ 100
METRIC RATING
128th/ 347
METRIC RANK
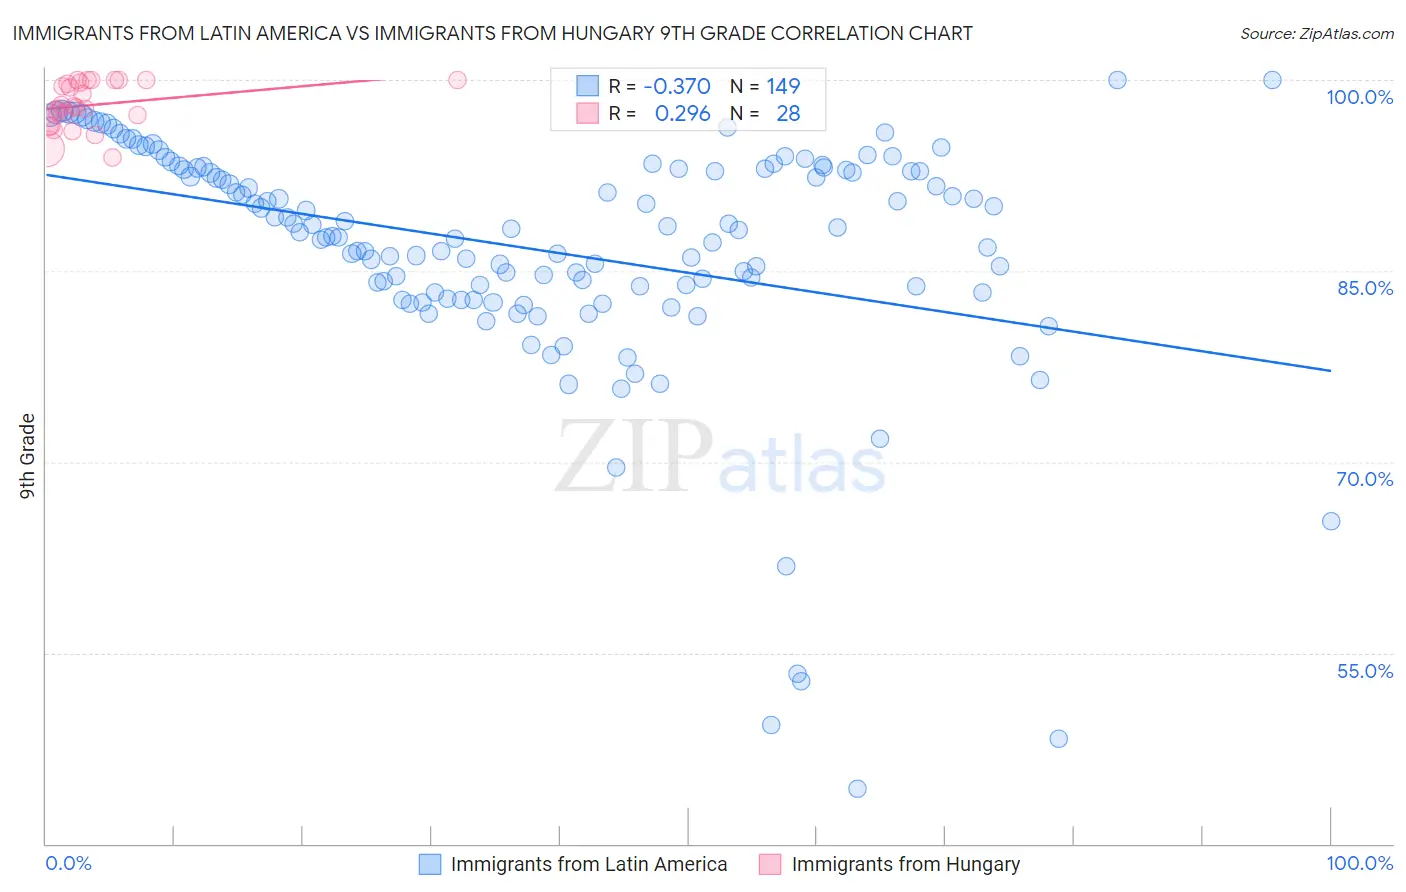
Immigrants from Latin America vs Immigrants from Hungary 9th Grade Correlation Chart
The statistical analysis conducted on geographies consisting of 558,651,576 people shows a mild negative correlation between the proportion of Immigrants from Latin America and percentage of population with at least 9th grade education in the United States with a correlation coefficient (R) of -0.370 and weighted average of 90.4%. Similarly, the statistical analysis conducted on geographies consisting of 195,707,305 people shows a weak positive correlation between the proportion of Immigrants from Hungary and percentage of population with at least 9th grade education in the United States with a correlation coefficient (R) of 0.296 and weighted average of 95.4%, a difference of 5.5%.
9th Grade Correlation Summary
| Measurement | Immigrants from Latin America | Immigrants from Hungary |
| Minimum | 44.3% | 93.9% |
| Maximum | 100.0% | 100.0% |
| Range | 55.7% | 6.1% |
| Mean | 86.7% | 98.0% |
| Median | 88.2% | 97.9% |
| Interquartile 25% (IQ1) | 83.3% | 96.8% |
| Interquartile 75% (IQ3) | 93.0% | 99.9% |
| Interquartile Range (IQR) | 9.7% | 3.1% |
| Standard Deviation (Sample) | 9.6% | 1.8% |
| Standard Deviation (Population) | 9.5% | 1.8% |
Similar Demographics by 9th Grade
Demographics Similar to Immigrants from Latin America by 9th Grade
In terms of 9th grade, the demographic groups most similar to Immigrants from Latin America are Central American (90.4%, a difference of 0.010%), Immigrants from Dominican Republic (90.5%, a difference of 0.12%), Immigrants from Honduras (90.6%, a difference of 0.25%), Yakama (90.1%, a difference of 0.35%), and Mexican (90.0%, a difference of 0.41%).
| Demographics | Rating | Rank | 9th Grade |
| Immigrants | Cabo Verde | 0.0 /100 | #330 | Tragic 90.9% |
| Mexican American Indians | 0.0 /100 | #331 | Tragic 90.9% |
| Hispanics or Latinos | 0.0 /100 | #332 | Tragic 90.9% |
| Immigrants | Yemen | 0.0 /100 | #333 | Tragic 90.8% |
| Immigrants | Azores | 0.0 /100 | #334 | Tragic 90.8% |
| Immigrants | Honduras | 0.0 /100 | #335 | Tragic 90.6% |
| Immigrants | Dominican Republic | 0.0 /100 | #336 | Tragic 90.5% |
| Immigrants | Latin America | 0.0 /100 | #337 | Tragic 90.4% |
| Central Americans | 0.0 /100 | #338 | Tragic 90.4% |
| Yakama | 0.0 /100 | #339 | Tragic 90.1% |
| Mexicans | 0.0 /100 | #340 | Tragic 90.0% |
| Guatemalans | 0.0 /100 | #341 | Tragic 89.9% |
| Salvadorans | 0.0 /100 | #342 | Tragic 89.6% |
| Immigrants | Guatemala | 0.0 /100 | #343 | Tragic 89.4% |
| Immigrants | El Salvador | 0.0 /100 | #344 | Tragic 89.0% |
Demographics Similar to Immigrants from Hungary by 9th Grade
In terms of 9th grade, the demographic groups most similar to Immigrants from Hungary are Palestinian (95.4%, a difference of 0.0%), Basque (95.4%, a difference of 0.0%), Immigrants from Serbia (95.4%, a difference of 0.010%), Jordanian (95.3%, a difference of 0.020%), and Immigrants from South Central Asia (95.4%, a difference of 0.030%).
| Demographics | Rating | Rank | 9th Grade |
| Cree | 95.5 /100 | #121 | Exceptional 95.4% |
| Immigrants | Kuwait | 95.5 /100 | #122 | Exceptional 95.4% |
| Kiowa | 95.3 /100 | #123 | Exceptional 95.4% |
| Shoshone | 95.3 /100 | #124 | Exceptional 95.4% |
| Immigrants | South Central Asia | 95.1 /100 | #125 | Exceptional 95.4% |
| Immigrants | Serbia | 94.4 /100 | #126 | Exceptional 95.4% |
| Palestinians | 94.3 /100 | #127 | Exceptional 95.4% |
| Immigrants | Hungary | 94.2 /100 | #128 | Exceptional 95.4% |
| Basques | 94.1 /100 | #129 | Exceptional 95.4% |
| Jordanians | 93.5 /100 | #130 | Exceptional 95.3% |
| Immigrants | North Macedonia | 92.3 /100 | #131 | Exceptional 95.3% |
| Immigrants | Nonimmigrants | 92.0 /100 | #132 | Exceptional 95.3% |
| Israelis | 90.4 /100 | #133 | Exceptional 95.3% |
| Immigrants | Israel | 89.6 /100 | #134 | Excellent 95.3% |
| Immigrants | Belarus | 88.9 /100 | #135 | Excellent 95.2% |