Immigrants from Sudan vs Tlingit-Haida Nursery School
COMPARE
Immigrants from Sudan
Tlingit-Haida
Nursery School
Nursery School Comparison
Immigrants from Sudan
Tlingit-Haida
97.7%
NURSERY SCHOOL
3.9/ 100
METRIC RATING
223rd/ 347
METRIC RANK
98.7%
NURSERY SCHOOL
100.0/ 100
METRIC RATING
11th/ 347
METRIC RANK
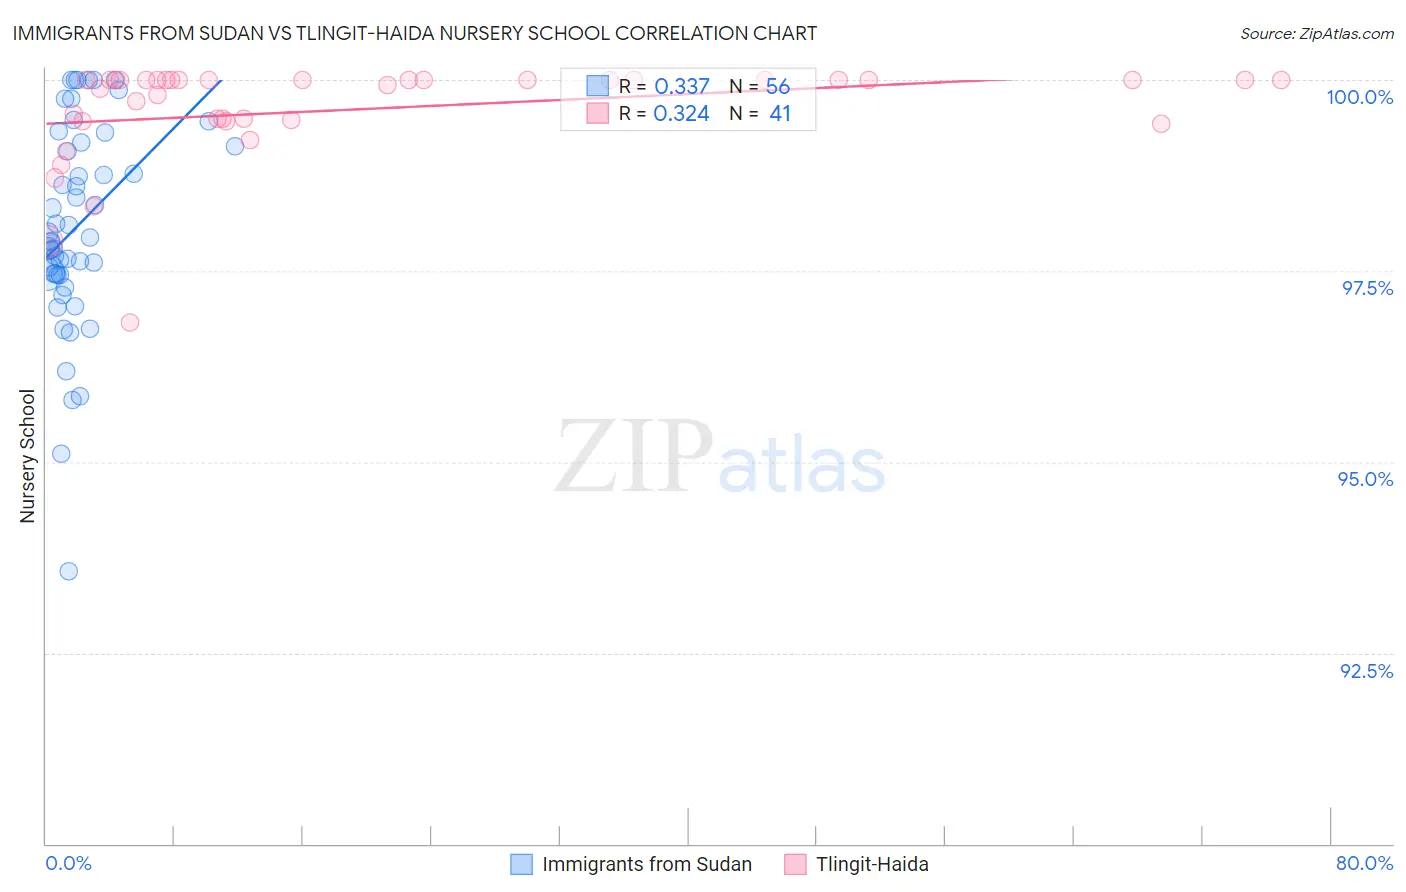
Immigrants from Sudan vs Tlingit-Haida Nursery School Correlation Chart
The statistical analysis conducted on geographies consisting of 118,957,985 people shows a mild positive correlation between the proportion of Immigrants from Sudan and percentage of population with at least nursery school education in the United States with a correlation coefficient (R) of 0.337 and weighted average of 97.7%. Similarly, the statistical analysis conducted on geographies consisting of 60,865,648 people shows a mild positive correlation between the proportion of Tlingit-Haida and percentage of population with at least nursery school education in the United States with a correlation coefficient (R) of 0.324 and weighted average of 98.7%, a difference of 1.0%.
Nursery School Correlation Summary
| Measurement | Immigrants from Sudan | Tlingit-Haida |
| Minimum | 93.6% | 96.8% |
| Maximum | 100.0% | 100.0% |
| Range | 6.4% | 3.2% |
| Mean | 98.1% | 99.6% |
| Median | 97.9% | 100.0% |
| Interquartile 25% (IQ1) | 97.5% | 99.5% |
| Interquartile 75% (IQ3) | 99.2% | 100.0% |
| Interquartile Range (IQR) | 1.7% | 0.53% |
| Standard Deviation (Sample) | 1.3% | 0.67% |
| Standard Deviation (Population) | 1.3% | 0.66% |
Similar Demographics by Nursery School
Demographics Similar to Immigrants from Sudan by Nursery School
In terms of nursery school, the demographic groups most similar to Immigrants from Sudan are Immigrants from Syria (97.7%, a difference of 0.0%), Immigrants from Zaire (97.8%, a difference of 0.010%), Tongan (97.8%, a difference of 0.010%), Immigrants from Nepal (97.7%, a difference of 0.010%), and Immigrants from Costa Rica (97.7%, a difference of 0.010%).
| Demographics | Rating | Rank | Nursery School |
| Uruguayans | 7.1 /100 | #216 | Tragic 97.8% |
| Samoans | 6.3 /100 | #217 | Tragic 97.8% |
| Immigrants | Panama | 5.3 /100 | #218 | Tragic 97.8% |
| Immigrants | Morocco | 5.1 /100 | #219 | Tragic 97.8% |
| Immigrants | Zaire | 4.4 /100 | #220 | Tragic 97.8% |
| Tongans | 4.3 /100 | #221 | Tragic 97.8% |
| Immigrants | Syria | 4.0 /100 | #222 | Tragic 97.7% |
| Immigrants | Sudan | 3.9 /100 | #223 | Tragic 97.7% |
| Immigrants | Nepal | 3.6 /100 | #224 | Tragic 97.7% |
| Immigrants | Costa Rica | 3.5 /100 | #225 | Tragic 97.7% |
| Iraqis | 3.5 /100 | #226 | Tragic 97.7% |
| Sub-Saharan Africans | 3.2 /100 | #227 | Tragic 97.7% |
| Sudanese | 3.2 /100 | #228 | Tragic 97.7% |
| Senegalese | 3.2 /100 | #229 | Tragic 97.7% |
| Sierra Leoneans | 2.9 /100 | #230 | Tragic 97.7% |
Demographics Similar to Tlingit-Haida by Nursery School
In terms of nursery school, the demographic groups most similar to Tlingit-Haida are German (98.7%, a difference of 0.0%), Slovak (98.7%, a difference of 0.010%), Norwegian (98.7%, a difference of 0.020%), Slovene (98.7%, a difference of 0.020%), and English (98.7%, a difference of 0.030%).
| Demographics | Rating | Rank | Nursery School |
| Inupiat | 100.0 /100 | #4 | Exceptional 98.9% |
| Tsimshian | 100.0 /100 | #5 | Exceptional 98.9% |
| Alaskan Athabascans | 100.0 /100 | #6 | Exceptional 98.8% |
| Alaska Natives | 100.0 /100 | #7 | Exceptional 98.8% |
| Norwegians | 100.0 /100 | #8 | Exceptional 98.7% |
| Slovaks | 100.0 /100 | #9 | Exceptional 98.7% |
| Germans | 100.0 /100 | #10 | Exceptional 98.7% |
| Tlingit-Haida | 100.0 /100 | #11 | Exceptional 98.7% |
| Slovenes | 100.0 /100 | #12 | Exceptional 98.7% |
| English | 100.0 /100 | #13 | Exceptional 98.7% |
| Carpatho Rusyns | 100.0 /100 | #14 | Exceptional 98.7% |
| Swedes | 100.0 /100 | #15 | Exceptional 98.7% |
| Scottish | 100.0 /100 | #16 | Exceptional 98.7% |
| Aleuts | 100.0 /100 | #17 | Exceptional 98.7% |
| Dutch | 100.0 /100 | #18 | Exceptional 98.7% |