Albanian vs Immigrants from Zaire Nursery School
COMPARE
Albanian
Immigrants from Zaire
Nursery School
Nursery School Comparison
Albanians
Immigrants from Zaire
98.0%
NURSERY SCHOOL
48.9/ 100
METRIC RATING
177th/ 347
METRIC RANK
97.8%
NURSERY SCHOOL
4.4/ 100
METRIC RATING
220th/ 347
METRIC RANK
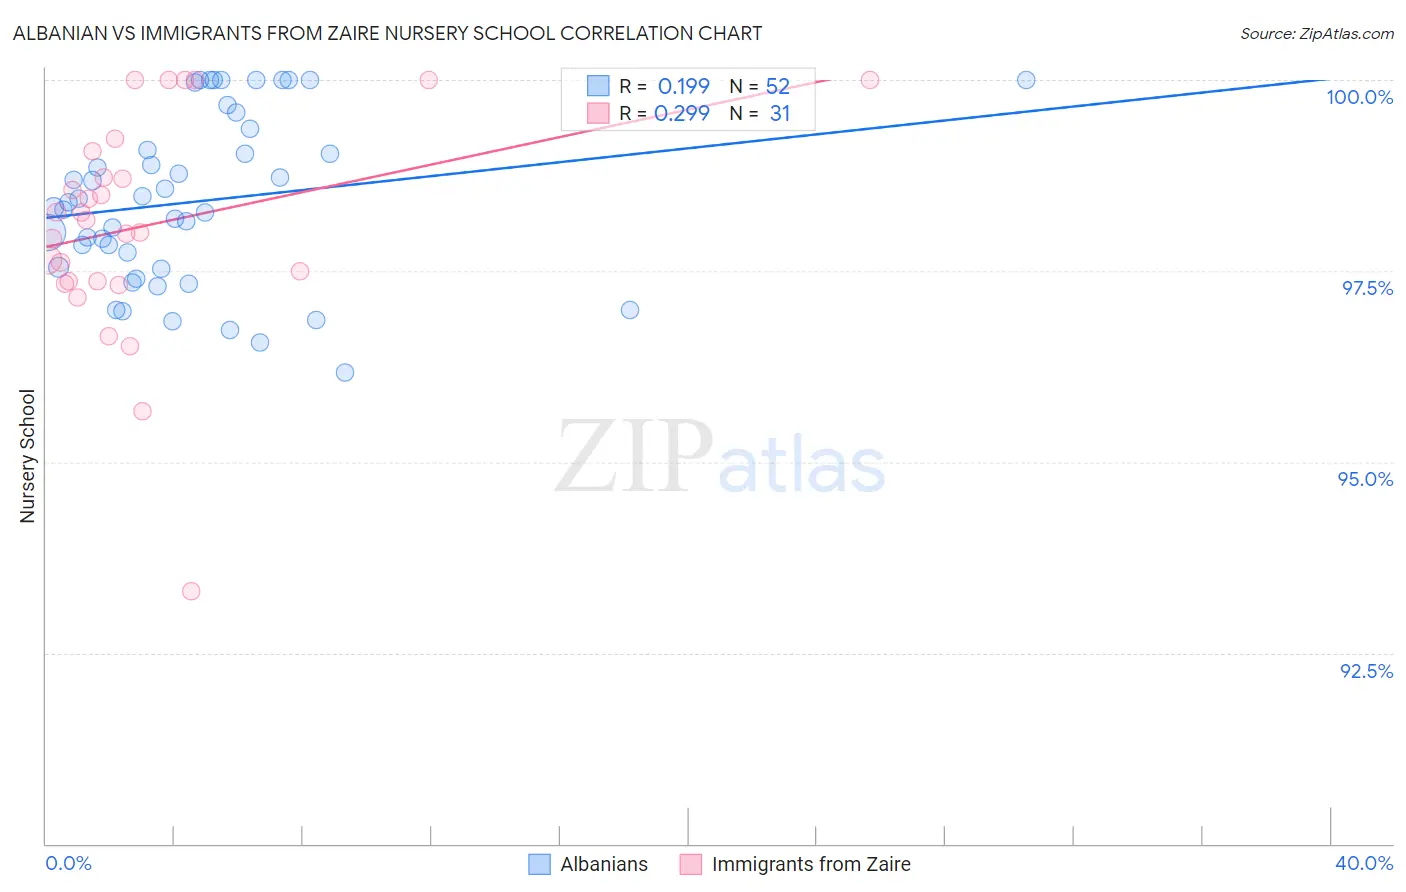
Albanian vs Immigrants from Zaire Nursery School Correlation Chart
The statistical analysis conducted on geographies consisting of 193,265,850 people shows a poor positive correlation between the proportion of Albanians and percentage of population with at least nursery school education in the United States with a correlation coefficient (R) of 0.199 and weighted average of 98.0%. Similarly, the statistical analysis conducted on geographies consisting of 107,250,996 people shows a weak positive correlation between the proportion of Immigrants from Zaire and percentage of population with at least nursery school education in the United States with a correlation coefficient (R) of 0.299 and weighted average of 97.8%, a difference of 0.23%.
Nursery School Correlation Summary
| Measurement | Albanian | Immigrants from Zaire |
| Minimum | 96.2% | 93.3% |
| Maximum | 100.0% | 100.0% |
| Range | 3.8% | 6.7% |
| Mean | 98.4% | 98.1% |
| Median | 98.4% | 98.2% |
| Interquartile 25% (IQ1) | 97.5% | 97.4% |
| Interquartile 75% (IQ3) | 99.2% | 99.1% |
| Interquartile Range (IQR) | 1.7% | 1.7% |
| Standard Deviation (Sample) | 1.1% | 1.4% |
| Standard Deviation (Population) | 1.1% | 1.4% |
Similar Demographics by Nursery School
Demographics Similar to Albanians by Nursery School
In terms of nursery school, the demographic groups most similar to Albanians are Kenyan (98.0%, a difference of 0.0%), Navajo (98.0%, a difference of 0.0%), Immigrants from Sri Lanka (98.0%, a difference of 0.0%), Immigrants from Venezuela (98.0%, a difference of 0.0%), and Native/Alaskan (98.0%, a difference of 0.0%).
| Demographics | Rating | Rank | Nursery School |
| Bermudans | 53.7 /100 | #170 | Average 98.0% |
| Immigrants | Jordan | 53.4 /100 | #171 | Average 98.0% |
| Immigrants | Brazil | 51.3 /100 | #172 | Average 98.0% |
| Kenyans | 50.2 /100 | #173 | Average 98.0% |
| Navajo | 50.0 /100 | #174 | Average 98.0% |
| Immigrants | Sri Lanka | 49.9 /100 | #175 | Average 98.0% |
| Immigrants | Venezuela | 49.8 /100 | #176 | Average 98.0% |
| Albanians | 48.9 /100 | #177 | Average 98.0% |
| Natives/Alaskans | 48.6 /100 | #178 | Average 98.0% |
| Argentineans | 46.8 /100 | #179 | Average 98.0% |
| Immigrants | Bosnia and Herzegovina | 45.6 /100 | #180 | Average 98.0% |
| Egyptians | 42.8 /100 | #181 | Average 98.0% |
| Paiute | 42.0 /100 | #182 | Average 98.0% |
| Portuguese | 41.8 /100 | #183 | Average 98.0% |
| Immigrants | Poland | 41.3 /100 | #184 | Average 98.0% |
Demographics Similar to Immigrants from Zaire by Nursery School
In terms of nursery school, the demographic groups most similar to Immigrants from Zaire are Tongan (97.8%, a difference of 0.0%), Immigrants from Morocco (97.8%, a difference of 0.010%), Immigrants from Syria (97.7%, a difference of 0.010%), Immigrants from Sudan (97.7%, a difference of 0.010%), and Immigrants from Nepal (97.7%, a difference of 0.010%).
| Demographics | Rating | Rank | Nursery School |
| Moroccans | 8.3 /100 | #213 | Tragic 97.8% |
| South American Indians | 8.0 /100 | #214 | Tragic 97.8% |
| Bahamians | 7.4 /100 | #215 | Tragic 97.8% |
| Uruguayans | 7.1 /100 | #216 | Tragic 97.8% |
| Samoans | 6.3 /100 | #217 | Tragic 97.8% |
| Immigrants | Panama | 5.3 /100 | #218 | Tragic 97.8% |
| Immigrants | Morocco | 5.1 /100 | #219 | Tragic 97.8% |
| Immigrants | Zaire | 4.4 /100 | #220 | Tragic 97.8% |
| Tongans | 4.3 /100 | #221 | Tragic 97.8% |
| Immigrants | Syria | 4.0 /100 | #222 | Tragic 97.7% |
| Immigrants | Sudan | 3.9 /100 | #223 | Tragic 97.7% |
| Immigrants | Nepal | 3.6 /100 | #224 | Tragic 97.7% |
| Immigrants | Costa Rica | 3.5 /100 | #225 | Tragic 97.7% |
| Iraqis | 3.5 /100 | #226 | Tragic 97.7% |
| Sub-Saharan Africans | 3.2 /100 | #227 | Tragic 97.7% |