Albanian vs Immigrants 10th Grade
COMPARE
Albanian
Immigrants
10th Grade
10th Grade Comparison
Albanians
Immigrants
94.1%
10TH GRADE
86.5/ 100
METRIC RATING
142nd/ 347
METRIC RANK
91.0%
10TH GRADE
0.0/ 100
METRIC RATING
309th/ 347
METRIC RANK
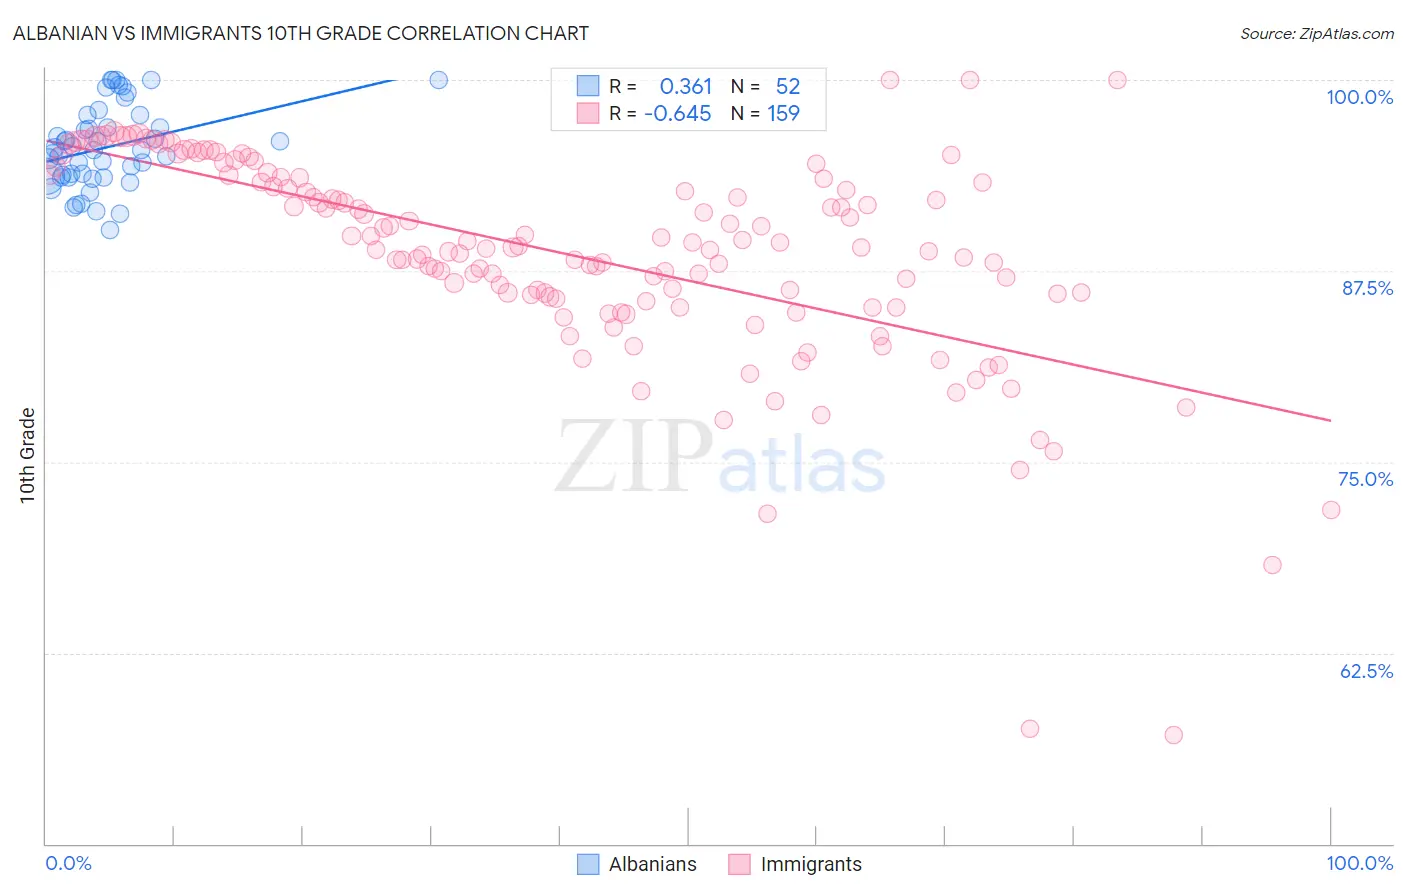
Albanian vs Immigrants 10th Grade Correlation Chart
The statistical analysis conducted on geographies consisting of 193,265,850 people shows a mild positive correlation between the proportion of Albanians and percentage of population with at least 10th grade education in the United States with a correlation coefficient (R) of 0.361 and weighted average of 94.1%. Similarly, the statistical analysis conducted on geographies consisting of 577,786,366 people shows a significant negative correlation between the proportion of Immigrants and percentage of population with at least 10th grade education in the United States with a correlation coefficient (R) of -0.645 and weighted average of 91.0%, a difference of 3.5%.
10th Grade Correlation Summary
| Measurement | Albanian | Immigrants |
| Minimum | 90.1% | 57.2% |
| Maximum | 100.0% | 100.0% |
| Range | 9.9% | 42.8% |
| Mean | 95.6% | 88.6% |
| Median | 95.4% | 89.1% |
| Interquartile 25% (IQ1) | 93.7% | 85.8% |
| Interquartile 75% (IQ3) | 97.3% | 93.6% |
| Interquartile Range (IQR) | 3.6% | 7.8% |
| Standard Deviation (Sample) | 2.6% | 6.9% |
| Standard Deviation (Population) | 2.6% | 6.8% |
Similar Demographics by 10th Grade
Demographics Similar to Albanians by 10th Grade
In terms of 10th grade, the demographic groups most similar to Albanians are Hmong (94.1%, a difference of 0.0%), Immigrants from Jordan (94.1%, a difference of 0.020%), Cherokee (94.1%, a difference of 0.030%), Immigrants from Kazakhstan (94.1%, a difference of 0.030%), and Nonimmigrants (94.1%, a difference of 0.050%).
| Demographics | Rating | Rank | 10th Grade |
| Immigrants | Korea | 91.3 /100 | #135 | Exceptional 94.2% |
| Shoshone | 90.8 /100 | #136 | Exceptional 94.2% |
| Arapaho | 90.5 /100 | #137 | Exceptional 94.2% |
| Immigrants | Sri Lanka | 89.9 /100 | #138 | Excellent 94.2% |
| Immigrants | Bosnia and Herzegovina | 89.4 /100 | #139 | Excellent 94.2% |
| Immigrants | Jordan | 87.6 /100 | #140 | Excellent 94.1% |
| Hmong | 86.6 /100 | #141 | Excellent 94.1% |
| Albanians | 86.5 /100 | #142 | Excellent 94.1% |
| Cherokee | 84.9 /100 | #143 | Excellent 94.1% |
| Immigrants | Kazakhstan | 84.9 /100 | #144 | Excellent 94.1% |
| Immigrants | Nonimmigrants | 83.8 /100 | #145 | Excellent 94.1% |
| Chickasaw | 82.6 /100 | #146 | Excellent 94.1% |
| Immigrants | Ukraine | 81.5 /100 | #147 | Excellent 94.0% |
| Arabs | 80.9 /100 | #148 | Excellent 94.0% |
| Ugandans | 80.7 /100 | #149 | Excellent 94.0% |
Demographics Similar to Immigrants by 10th Grade
In terms of 10th grade, the demographic groups most similar to Immigrants are Immigrants from Bangladesh (91.0%, a difference of 0.040%), Vietnamese (90.9%, a difference of 0.040%), Immigrants from Fiji (91.0%, a difference of 0.050%), Immigrants from Cambodia (90.9%, a difference of 0.060%), and Yaqui (91.1%, a difference of 0.11%).
| Demographics | Rating | Rank | 10th Grade |
| Immigrants | Guyana | 0.0 /100 | #302 | Tragic 91.2% |
| Immigrants | Vietnam | 0.0 /100 | #303 | Tragic 91.2% |
| Pima | 0.0 /100 | #304 | Tragic 91.2% |
| Immigrants | Dominica | 0.0 /100 | #305 | Tragic 91.1% |
| Yaqui | 0.0 /100 | #306 | Tragic 91.1% |
| Immigrants | Fiji | 0.0 /100 | #307 | Tragic 91.0% |
| Immigrants | Bangladesh | 0.0 /100 | #308 | Tragic 91.0% |
| Immigrants | Immigrants | 0.0 /100 | #309 | Tragic 91.0% |
| Vietnamese | 0.0 /100 | #310 | Tragic 90.9% |
| Immigrants | Cambodia | 0.0 /100 | #311 | Tragic 90.9% |
| Immigrants | Portugal | 0.0 /100 | #312 | Tragic 90.8% |
| Cape Verdeans | 0.0 /100 | #313 | Tragic 90.8% |
| Nepalese | 0.0 /100 | #314 | Tragic 90.7% |
| Immigrants | Caribbean | 0.0 /100 | #315 | Tragic 90.6% |
| Ecuadorians | 0.0 /100 | #316 | Tragic 90.6% |