Albanian vs Immigrants from Colombia 3rd Grade
COMPARE
Albanian
Immigrants from Colombia
3rd Grade
3rd Grade Comparison
Albanians
Immigrants from Colombia
97.8%
3RD GRADE
58.8/ 100
METRIC RATING
161st/ 347
METRIC RANK
97.3%
3RD GRADE
0.5/ 100
METRIC RATING
257th/ 347
METRIC RANK
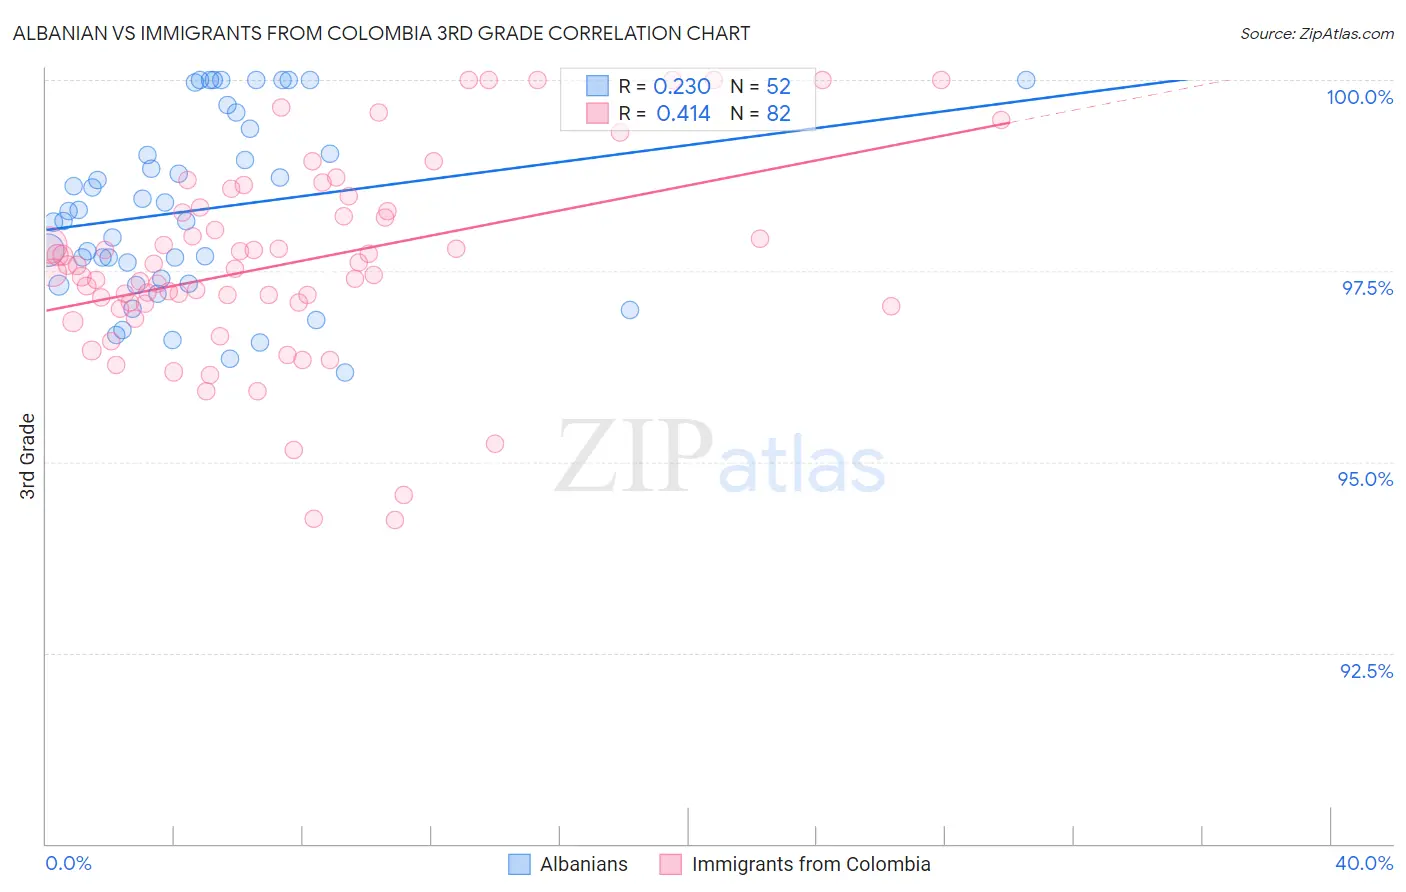
Albanian vs Immigrants from Colombia 3rd Grade Correlation Chart
The statistical analysis conducted on geographies consisting of 193,265,850 people shows a weak positive correlation between the proportion of Albanians and percentage of population with at least 3rd grade education in the United States with a correlation coefficient (R) of 0.230 and weighted average of 97.8%. Similarly, the statistical analysis conducted on geographies consisting of 378,643,693 people shows a moderate positive correlation between the proportion of Immigrants from Colombia and percentage of population with at least 3rd grade education in the United States with a correlation coefficient (R) of 0.414 and weighted average of 97.3%, a difference of 0.48%.
3rd Grade Correlation Summary
| Measurement | Albanian | Immigrants from Colombia |
| Minimum | 96.2% | 94.2% |
| Maximum | 100.0% | 100.0% |
| Range | 3.8% | 5.8% |
| Mean | 98.3% | 97.6% |
| Median | 98.2% | 97.5% |
| Interquartile 25% (IQ1) | 97.4% | 97.1% |
| Interquartile 75% (IQ3) | 99.2% | 98.3% |
| Interquartile Range (IQR) | 1.8% | 1.2% |
| Standard Deviation (Sample) | 1.2% | 1.3% |
| Standard Deviation (Population) | 1.2% | 1.3% |
Similar Demographics by 3rd Grade
Demographics Similar to Albanians by 3rd Grade
In terms of 3rd grade, the demographic groups most similar to Albanians are French American Indian (97.8%, a difference of 0.0%), Immigrants from Iran (97.8%, a difference of 0.0%), Immigrants from Jordan (97.8%, a difference of 0.0%), Bermudan (97.8%, a difference of 0.010%), and Immigrants from Russia (97.8%, a difference of 0.010%).
| Demographics | Rating | Rank | 3rd Grade |
| Immigrants | Eastern Europe | 64.1 /100 | #154 | Good 97.8% |
| Bermudans | 62.6 /100 | #155 | Good 97.8% |
| Immigrants | Russia | 61.7 /100 | #156 | Good 97.8% |
| Immigrants | Italy | 61.2 /100 | #157 | Good 97.8% |
| Venezuelans | 60.9 /100 | #158 | Good 97.8% |
| French American Indians | 60.0 /100 | #159 | Average 97.8% |
| Immigrants | Iran | 59.1 /100 | #160 | Average 97.8% |
| Albanians | 58.8 /100 | #161 | Average 97.8% |
| Immigrants | Jordan | 57.9 /100 | #162 | Average 97.8% |
| Marshallese | 57.2 /100 | #163 | Average 97.8% |
| Immigrants | Bosnia and Herzegovina | 56.2 /100 | #164 | Average 97.8% |
| Ugandans | 56.1 /100 | #165 | Average 97.8% |
| Dutch West Indians | 55.5 /100 | #166 | Average 97.8% |
| Chileans | 55.3 /100 | #167 | Average 97.8% |
| Immigrants | Spain | 54.3 /100 | #168 | Average 97.8% |
Demographics Similar to Immigrants from Colombia by 3rd Grade
In terms of 3rd grade, the demographic groups most similar to Immigrants from Colombia are Bolivian (97.3%, a difference of 0.010%), Immigrants from Congo (97.3%, a difference of 0.010%), Immigrants from Liberia (97.3%, a difference of 0.010%), Armenian (97.3%, a difference of 0.020%), and Immigrants from Ethiopia (97.3%, a difference of 0.020%).
| Demographics | Rating | Rank | 3rd Grade |
| Immigrants | Middle Africa | 0.9 /100 | #250 | Tragic 97.4% |
| Immigrants | Asia | 0.8 /100 | #251 | Tragic 97.4% |
| Peruvians | 0.8 /100 | #252 | Tragic 97.4% |
| Immigrants | Africa | 0.8 /100 | #253 | Tragic 97.4% |
| Jamaicans | 0.7 /100 | #254 | Tragic 97.4% |
| Bolivians | 0.6 /100 | #255 | Tragic 97.3% |
| Immigrants | Congo | 0.6 /100 | #256 | Tragic 97.3% |
| Immigrants | Colombia | 0.5 /100 | #257 | Tragic 97.3% |
| Immigrants | Liberia | 0.5 /100 | #258 | Tragic 97.3% |
| Armenians | 0.4 /100 | #259 | Tragic 97.3% |
| Immigrants | Ethiopia | 0.4 /100 | #260 | Tragic 97.3% |
| Immigrants | South America | 0.4 /100 | #261 | Tragic 97.3% |
| Immigrants | Sierra Leone | 0.4 /100 | #262 | Tragic 97.3% |
| Taiwanese | 0.3 /100 | #263 | Tragic 97.3% |
| West Indians | 0.3 /100 | #264 | Tragic 97.3% |