Immigrants from Western Asia vs Sierra Leonean 6th Grade
COMPARE
Immigrants from Western Asia
Sierra Leonean
6th Grade
6th Grade Comparison
Immigrants from Western Asia
Sierra Leoneans
96.7%
6TH GRADE
4.1/ 100
METRIC RATING
227th/ 347
METRIC RANK
96.8%
6TH GRADE
8.0/ 100
METRIC RATING
215th/ 347
METRIC RANK
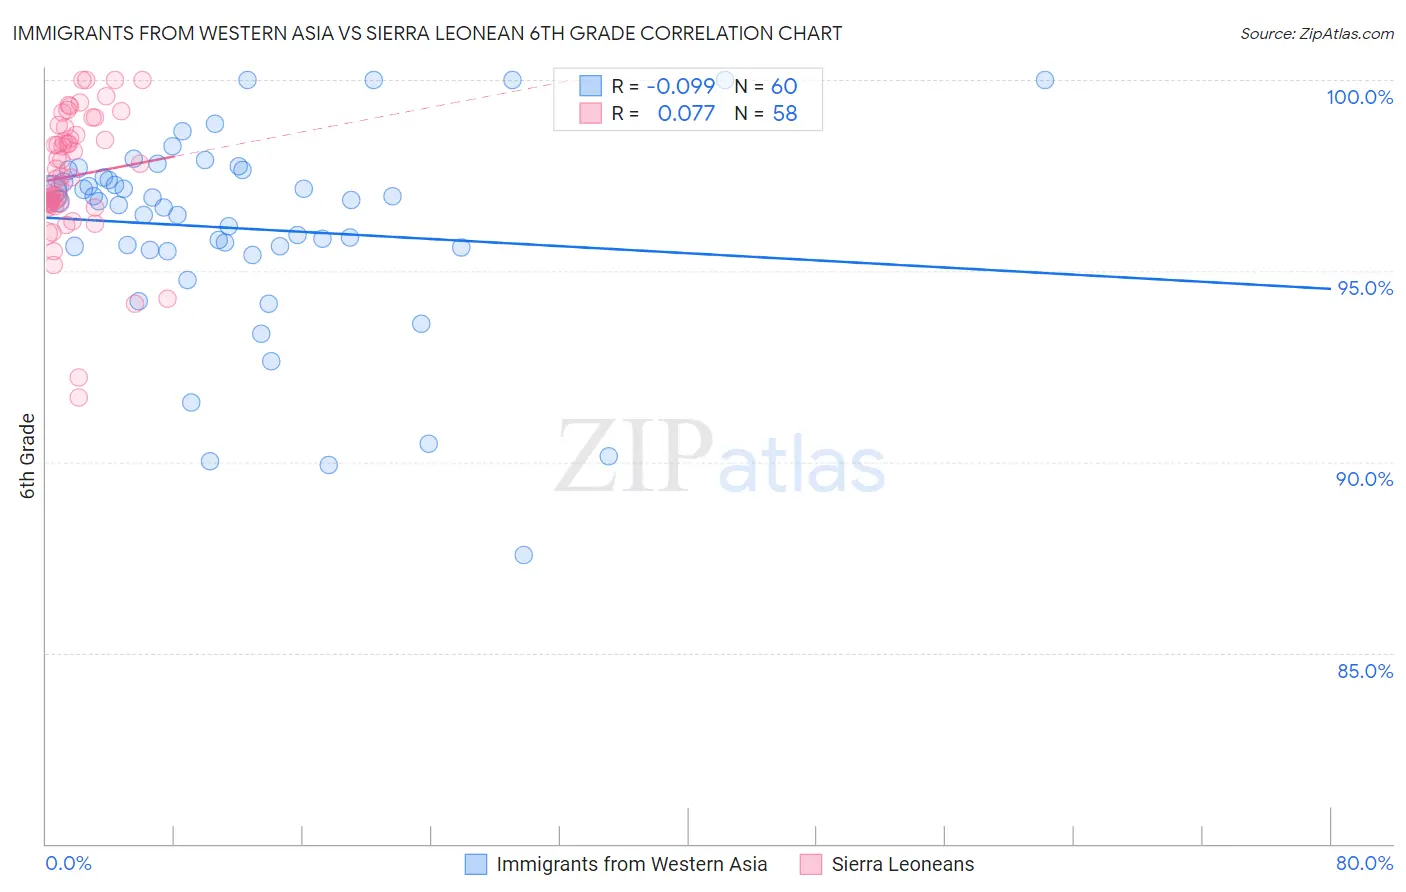
Immigrants from Western Asia vs Sierra Leonean 6th Grade Correlation Chart
The statistical analysis conducted on geographies consisting of 404,389,948 people shows a slight negative correlation between the proportion of Immigrants from Western Asia and percentage of population with at least 6th grade education in the United States with a correlation coefficient (R) of -0.099 and weighted average of 96.7%. Similarly, the statistical analysis conducted on geographies consisting of 83,337,655 people shows a slight positive correlation between the proportion of Sierra Leoneans and percentage of population with at least 6th grade education in the United States with a correlation coefficient (R) of 0.077 and weighted average of 96.8%, a difference of 0.080%.
6th Grade Correlation Summary
| Measurement | Immigrants from Western Asia | Sierra Leonean |
| Minimum | 87.6% | 91.7% |
| Maximum | 100.0% | 100.0% |
| Range | 12.4% | 8.3% |
| Mean | 96.1% | 97.5% |
| Median | 96.8% | 97.6% |
| Interquartile 25% (IQ1) | 95.6% | 96.7% |
| Interquartile 75% (IQ3) | 97.5% | 98.8% |
| Interquartile Range (IQR) | 2.0% | 2.0% |
| Standard Deviation (Sample) | 2.6% | 1.7% |
| Standard Deviation (Population) | 2.6% | 1.7% |
Demographics Similar to Immigrants from Western Asia and Sierra Leoneans by 6th Grade
In terms of 6th grade, the demographic groups most similar to Immigrants from Western Asia are Immigrants from Panama (96.7%, a difference of 0.0%), Immigrants from Malaysia (96.7%, a difference of 0.0%), Assyrian/Chaldean/Syriac (96.7%, a difference of 0.0%), Immigrants from Eastern Asia (96.7%, a difference of 0.0%), and Immigrants from Southern Europe (96.7%, a difference of 0.010%). Similarly, the demographic groups most similar to Sierra Leoneans are Portuguese (96.8%, a difference of 0.0%), Paiute (96.8%, a difference of 0.0%), Moroccan (96.8%, a difference of 0.010%), Immigrants from Sudan (96.8%, a difference of 0.010%), and Liberian (96.8%, a difference of 0.010%).
| Demographics | Rating | Rank | 6th Grade |
| Immigrants | Iraq | 9.2 /100 | #211 | Tragic 96.8% |
| Moroccans | 9.0 /100 | #212 | Tragic 96.8% |
| Immigrants | Sudan | 8.7 /100 | #213 | Tragic 96.8% |
| Portuguese | 8.2 /100 | #214 | Tragic 96.8% |
| Sierra Leoneans | 8.0 /100 | #215 | Tragic 96.8% |
| Paiute | 7.8 /100 | #216 | Tragic 96.8% |
| Liberians | 7.5 /100 | #217 | Tragic 96.8% |
| Navajo | 7.3 /100 | #218 | Tragic 96.8% |
| Costa Ricans | 6.8 /100 | #219 | Tragic 96.8% |
| Immigrants | Morocco | 6.2 /100 | #220 | Tragic 96.7% |
| Tongans | 6.1 /100 | #221 | Tragic 96.7% |
| Immigrants | Syria | 5.9 /100 | #222 | Tragic 96.7% |
| Bahamians | 4.8 /100 | #223 | Tragic 96.7% |
| Immigrants | Southern Europe | 4.4 /100 | #224 | Tragic 96.7% |
| Immigrants | Pakistan | 4.4 /100 | #225 | Tragic 96.7% |
| Immigrants | Panama | 4.2 /100 | #226 | Tragic 96.7% |
| Immigrants | Western Asia | 4.1 /100 | #227 | Tragic 96.7% |
| Immigrants | Malaysia | 4.0 /100 | #228 | Tragic 96.7% |
| Assyrians/Chaldeans/Syriacs | 4.0 /100 | #229 | Tragic 96.7% |
| Immigrants | Eastern Asia | 4.0 /100 | #230 | Tragic 96.7% |
| Sub-Saharan Africans | 3.5 /100 | #231 | Tragic 96.7% |