African vs Slavic 4th Grade
COMPARE
African
Slavic
4th Grade
4th Grade Comparison
Africans
Slavs
97.4%
4TH GRADE
14.6/ 100
METRIC RATING
204th/ 347
METRIC RANK
98.1%
4TH GRADE
99.8/ 100
METRIC RATING
53rd/ 347
METRIC RANK
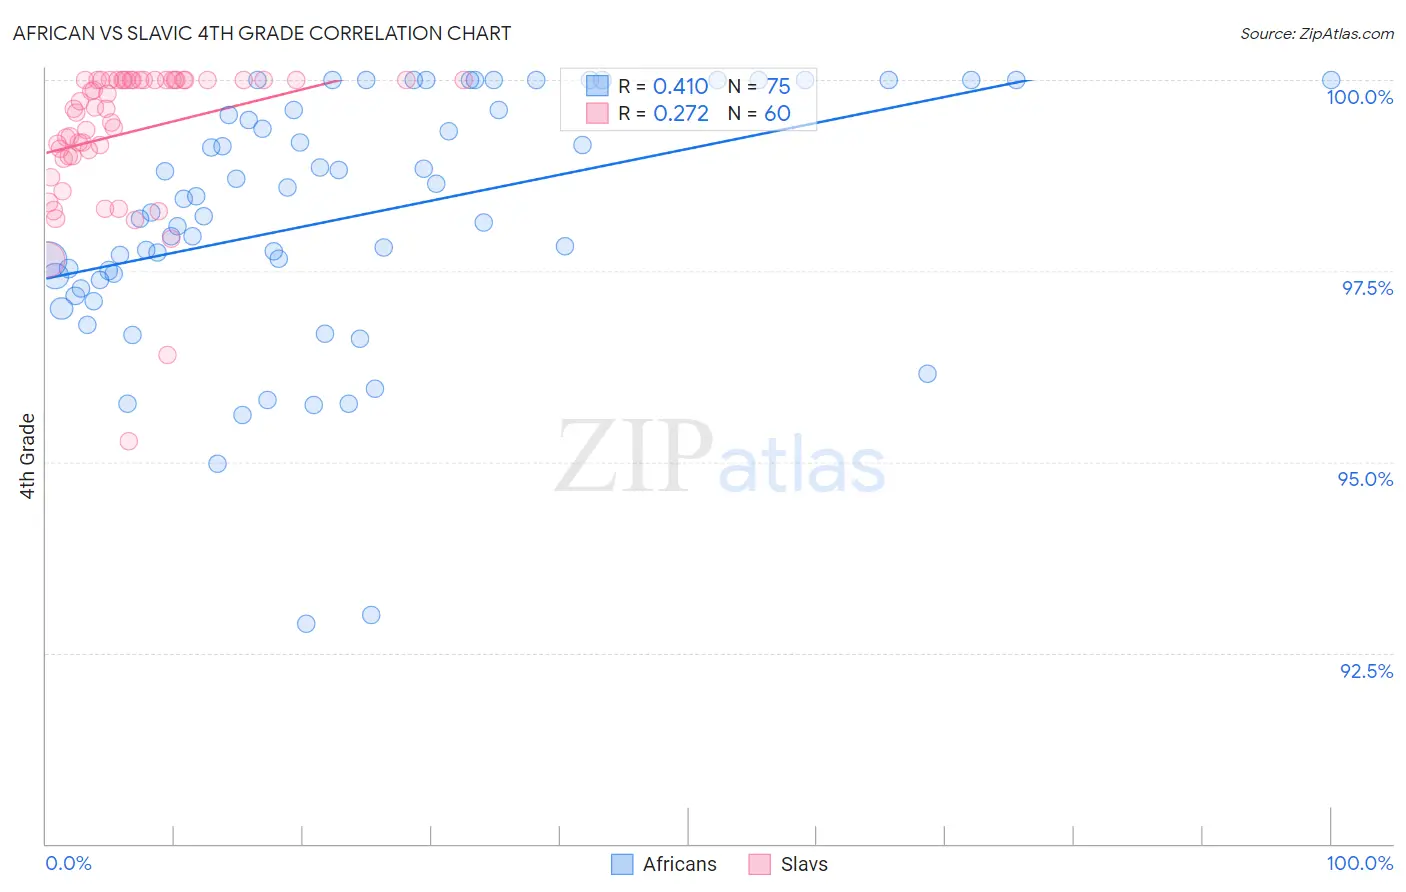
African vs Slavic 4th Grade Correlation Chart
The statistical analysis conducted on geographies consisting of 470,094,744 people shows a moderate positive correlation between the proportion of Africans and percentage of population with at least 4th grade education in the United States with a correlation coefficient (R) of 0.410 and weighted average of 97.4%. Similarly, the statistical analysis conducted on geographies consisting of 270,869,056 people shows a weak positive correlation between the proportion of Slavs and percentage of population with at least 4th grade education in the United States with a correlation coefficient (R) of 0.272 and weighted average of 98.1%, a difference of 0.75%.
4th Grade Correlation Summary
| Measurement | African | Slavic |
| Minimum | 92.9% | 95.3% |
| Maximum | 100.0% | 100.0% |
| Range | 7.1% | 4.7% |
| Mean | 98.2% | 99.3% |
| Median | 98.3% | 99.6% |
| Interquartile 25% (IQ1) | 97.4% | 99.0% |
| Interquartile 75% (IQ3) | 99.6% | 100.0% |
| Interquartile Range (IQR) | 2.2% | 1.00% |
| Standard Deviation (Sample) | 1.6% | 0.94% |
| Standard Deviation (Population) | 1.6% | 0.93% |
Similar Demographics by 4th Grade
Demographics Similar to Africans by 4th Grade
In terms of 4th grade, the demographic groups most similar to Africans are Immigrants from Northern Africa (97.4%, a difference of 0.0%), Immigrants from Southern Europe (97.4%, a difference of 0.010%), Immigrants from Chile (97.4%, a difference of 0.010%), Paiute (97.3%, a difference of 0.010%), and Immigrants from Zaire (97.3%, a difference of 0.010%).
| Demographics | Rating | Rank | 4th Grade |
| Hawaiians | 25.6 /100 | #197 | Fair 97.4% |
| Guamanians/Chamorros | 23.0 /100 | #198 | Fair 97.4% |
| Natives/Alaskans | 20.6 /100 | #199 | Fair 97.4% |
| Immigrants | Uganda | 19.8 /100 | #200 | Poor 97.4% |
| Immigrants | Southern Europe | 16.2 /100 | #201 | Poor 97.4% |
| Immigrants | Chile | 16.1 /100 | #202 | Poor 97.4% |
| Immigrants | Northern Africa | 15.1 /100 | #203 | Poor 97.4% |
| Africans | 14.6 /100 | #204 | Poor 97.4% |
| Paiute | 13.2 /100 | #205 | Poor 97.3% |
| Immigrants | Zaire | 12.8 /100 | #206 | Poor 97.3% |
| Moroccans | 11.3 /100 | #207 | Poor 97.3% |
| Immigrants | Bahamas | 10.8 /100 | #208 | Poor 97.3% |
| Laotians | 9.3 /100 | #209 | Tragic 97.3% |
| Immigrants | Oceania | 9.1 /100 | #210 | Tragic 97.3% |
| Sudanese | 9.0 /100 | #211 | Tragic 97.3% |
Demographics Similar to Slavs by 4th Grade
In terms of 4th grade, the demographic groups most similar to Slavs are Australian (98.1%, a difference of 0.0%), Maltese (98.1%, a difference of 0.0%), White/Caucasian (98.1%, a difference of 0.0%), Bulgarian (98.1%, a difference of 0.010%), and Immigrants from Scotland (98.1%, a difference of 0.010%).
| Demographics | Rating | Rank | 4th Grade |
| Ottawa | 99.9 /100 | #46 | Exceptional 98.1% |
| Arapaho | 99.9 /100 | #47 | Exceptional 98.1% |
| Estonians | 99.8 /100 | #48 | Exceptional 98.1% |
| Bulgarians | 99.8 /100 | #49 | Exceptional 98.1% |
| Immigrants | Scotland | 99.8 /100 | #50 | Exceptional 98.1% |
| Celtics | 99.8 /100 | #51 | Exceptional 98.1% |
| Australians | 99.8 /100 | #52 | Exceptional 98.1% |
| Slavs | 99.8 /100 | #53 | Exceptional 98.1% |
| Maltese | 99.8 /100 | #54 | Exceptional 98.1% |
| Whites/Caucasians | 99.8 /100 | #55 | Exceptional 98.1% |
| Greeks | 99.8 /100 | #56 | Exceptional 98.1% |
| Austrians | 99.8 /100 | #57 | Exceptional 98.1% |
| Creek | 99.8 /100 | #58 | Exceptional 98.1% |
| Americans | 99.8 /100 | #59 | Exceptional 98.1% |
| Immigrants | Canada | 99.7 /100 | #60 | Exceptional 98.1% |