Pima vs Immigrants from Poland 6th Grade
COMPARE
Pima
Immigrants from Poland
6th Grade
6th Grade Comparison
Pima
Immigrants from Poland
97.2%
6TH GRADE
82.9/ 100
METRIC RATING
143rd/ 347
METRIC RANK
97.1%
6TH GRADE
56.2/ 100
METRIC RATING
165th/ 347
METRIC RANK
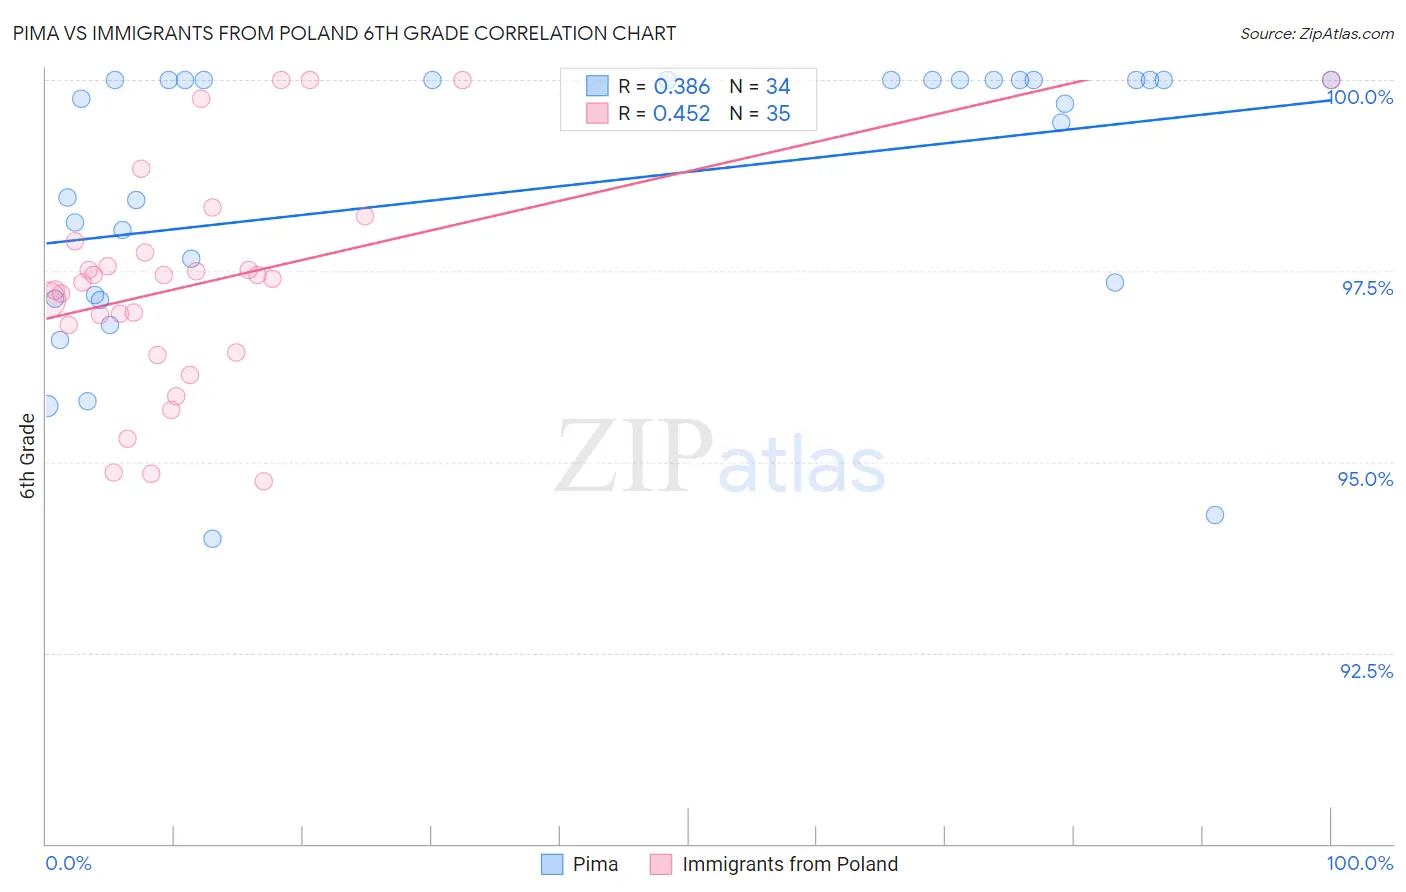
Pima vs Immigrants from Poland 6th Grade Correlation Chart
The statistical analysis conducted on geographies consisting of 61,552,942 people shows a mild positive correlation between the proportion of Pima and percentage of population with at least 6th grade education in the United States with a correlation coefficient (R) of 0.386 and weighted average of 97.2%. Similarly, the statistical analysis conducted on geographies consisting of 304,861,559 people shows a moderate positive correlation between the proportion of Immigrants from Poland and percentage of population with at least 6th grade education in the United States with a correlation coefficient (R) of 0.452 and weighted average of 97.1%, a difference of 0.15%.
6th Grade Correlation Summary
| Measurement | Pima | Immigrants from Poland |
| Minimum | 94.0% | 94.8% |
| Maximum | 100.0% | 100.0% |
| Range | 6.0% | 5.2% |
| Mean | 98.6% | 97.4% |
| Median | 99.7% | 97.4% |
| Interquartile 25% (IQ1) | 97.2% | 96.4% |
| Interquartile 75% (IQ3) | 100.0% | 97.9% |
| Interquartile Range (IQR) | 2.8% | 1.5% |
| Standard Deviation (Sample) | 1.8% | 1.4% |
| Standard Deviation (Population) | 1.8% | 1.4% |
Similar Demographics by 6th Grade
Demographics Similar to Pima by 6th Grade
In terms of 6th grade, the demographic groups most similar to Pima are Israeli (97.2%, a difference of 0.0%), Jordanian (97.2%, a difference of 0.010%), Immigrants from North Macedonia (97.2%, a difference of 0.020%), Seminole (97.2%, a difference of 0.020%), and Spaniard (97.2%, a difference of 0.020%).
| Demographics | Rating | Rank | 6th Grade |
| Filipinos | 88.9 /100 | #136 | Excellent 97.3% |
| Burmese | 87.8 /100 | #137 | Excellent 97.3% |
| Blackfeet | 87.7 /100 | #138 | Excellent 97.3% |
| Immigrants | Turkey | 86.1 /100 | #139 | Excellent 97.3% |
| Immigrants | North Macedonia | 85.5 /100 | #140 | Excellent 97.2% |
| Seminole | 84.8 /100 | #141 | Excellent 97.2% |
| Jordanians | 84.6 /100 | #142 | Excellent 97.2% |
| Pima | 82.9 /100 | #143 | Excellent 97.2% |
| Israelis | 82.9 /100 | #144 | Excellent 97.2% |
| Spaniards | 80.1 /100 | #145 | Excellent 97.2% |
| Hopi | 78.8 /100 | #146 | Good 97.2% |
| Immigrants | South Central Asia | 78.1 /100 | #147 | Good 97.2% |
| Immigrants | Greece | 77.8 /100 | #148 | Good 97.2% |
| Immigrants | Israel | 76.0 /100 | #149 | Good 97.2% |
| Immigrants | Bosnia and Herzegovina | 74.8 /100 | #150 | Good 97.2% |
Demographics Similar to Immigrants from Poland by 6th Grade
In terms of 6th grade, the demographic groups most similar to Immigrants from Poland are Albanian (97.1%, a difference of 0.010%), Immigrants from Korea (97.1%, a difference of 0.010%), Immigrants from Italy (97.1%, a difference of 0.010%), Apache (97.1%, a difference of 0.010%), and Immigrants from Taiwan (97.1%, a difference of 0.010%).
| Demographics | Rating | Rank | 6th Grade |
| Immigrants | Iran | 63.3 /100 | #158 | Good 97.1% |
| Kenyans | 62.9 /100 | #159 | Good 97.1% |
| Ugandans | 62.2 /100 | #160 | Good 97.1% |
| Immigrants | Belarus | 60.4 /100 | #161 | Good 97.1% |
| Marshallese | 60.2 /100 | #162 | Good 97.1% |
| Albanians | 57.8 /100 | #163 | Average 97.1% |
| Immigrants | Korea | 57.7 /100 | #164 | Average 97.1% |
| Immigrants | Poland | 56.2 /100 | #165 | Average 97.1% |
| Immigrants | Italy | 53.8 /100 | #166 | Average 97.1% |
| Apache | 53.6 /100 | #167 | Average 97.1% |
| Immigrants | Taiwan | 53.5 /100 | #168 | Average 97.1% |
| Bermudans | 52.6 /100 | #169 | Average 97.1% |
| Chileans | 52.1 /100 | #170 | Average 97.1% |
| Immigrants | Sri Lanka | 51.7 /100 | #171 | Average 97.1% |
| Egyptians | 50.9 /100 | #172 | Average 97.1% |