Immigrants from Jamaica vs Immigrants from Bolivia College, 1 year or more
COMPARE
Immigrants from Jamaica
Immigrants from Bolivia
College, 1 year or more
College, 1 year or more Comparison
Immigrants from Jamaica
Immigrants from Bolivia
54.2%
COLLEGE, 1 YEAR OR MORE
0.1/ 100
METRIC RATING
278th/ 347
METRIC RANK
62.8%
COLLEGE, 1 YEAR OR MORE
98.7/ 100
METRIC RATING
82nd/ 347
METRIC RANK
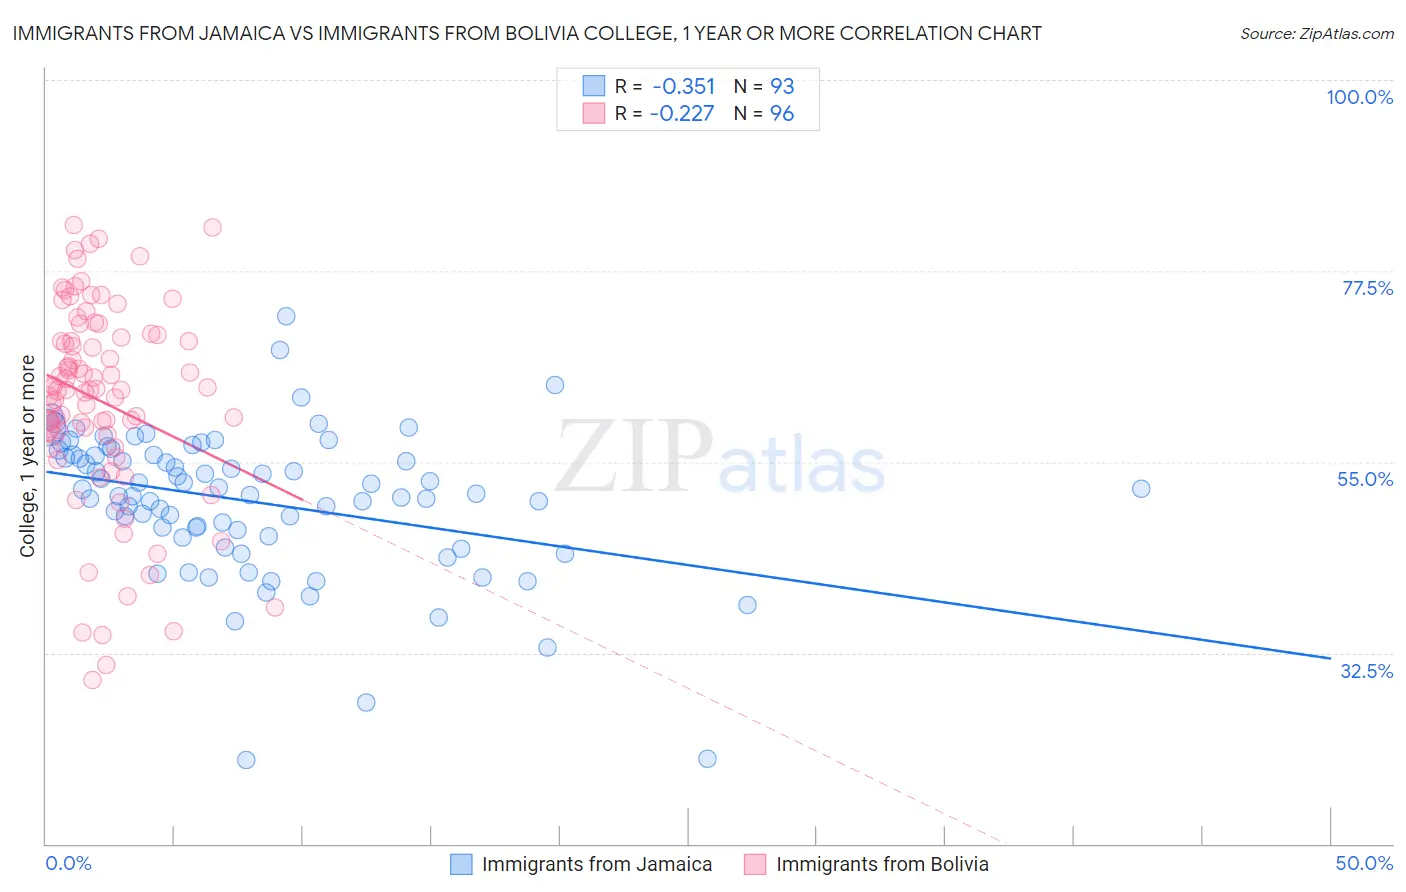
Immigrants from Jamaica vs Immigrants from Bolivia College, 1 year or more Correlation Chart
The statistical analysis conducted on geographies consisting of 301,826,812 people shows a mild negative correlation between the proportion of Immigrants from Jamaica and percentage of population with at least college, 1 year or more education in the United States with a correlation coefficient (R) of -0.351 and weighted average of 54.2%. Similarly, the statistical analysis conducted on geographies consisting of 158,732,804 people shows a weak negative correlation between the proportion of Immigrants from Bolivia and percentage of population with at least college, 1 year or more education in the United States with a correlation coefficient (R) of -0.227 and weighted average of 62.8%, a difference of 16.0%.
College, 1 year or more Correlation Summary
| Measurement | Immigrants from Jamaica | Immigrants from Bolivia |
| Minimum | 19.8% | 29.3% |
| Maximum | 72.1% | 82.9% |
| Range | 52.3% | 53.5% |
| Mean | 50.3% | 62.2% |
| Median | 51.2% | 63.5% |
| Interquartile 25% (IQ1) | 46.2% | 58.1% |
| Interquartile 75% (IQ3) | 55.9% | 69.8% |
| Interquartile Range (IQR) | 9.7% | 11.7% |
| Standard Deviation (Sample) | 8.7% | 11.9% |
| Standard Deviation (Population) | 8.7% | 11.8% |
Similar Demographics by College, 1 year or more
Demographics Similar to Immigrants from Jamaica by College, 1 year or more
In terms of college, 1 year or more, the demographic groups most similar to Immigrants from Jamaica are Arapaho (54.1%, a difference of 0.020%), Cheyenne (54.1%, a difference of 0.070%), Colville (54.1%, a difference of 0.090%), Guyanese (54.1%, a difference of 0.13%), and Ecuadorian (54.3%, a difference of 0.32%).
| Demographics | Rating | Rank | College, 1 year or more |
| Bahamians | 0.2 /100 | #271 | Tragic 54.5% |
| Comanche | 0.2 /100 | #272 | Tragic 54.4% |
| Immigrants | Grenada | 0.2 /100 | #273 | Tragic 54.4% |
| Belizeans | 0.2 /100 | #274 | Tragic 54.4% |
| Americans | 0.2 /100 | #275 | Tragic 54.4% |
| Shoshone | 0.2 /100 | #276 | Tragic 54.3% |
| Ecuadorians | 0.2 /100 | #277 | Tragic 54.3% |
| Immigrants | Jamaica | 0.1 /100 | #278 | Tragic 54.2% |
| Arapaho | 0.1 /100 | #279 | Tragic 54.1% |
| Cheyenne | 0.1 /100 | #280 | Tragic 54.1% |
| Colville | 0.1 /100 | #281 | Tragic 54.1% |
| Guyanese | 0.1 /100 | #282 | Tragic 54.1% |
| Nicaraguans | 0.1 /100 | #283 | Tragic 53.9% |
| Ute | 0.1 /100 | #284 | Tragic 53.8% |
| Immigrants | Guyana | 0.1 /100 | #285 | Tragic 53.5% |
Demographics Similar to Immigrants from Bolivia by College, 1 year or more
In terms of college, 1 year or more, the demographic groups most similar to Immigrants from Bolivia are Immigrants from Argentina (62.8%, a difference of 0.040%), Laotian (62.8%, a difference of 0.050%), Immigrants from England (62.8%, a difference of 0.070%), Immigrants from Pakistan (62.8%, a difference of 0.080%), and Lithuanian (62.9%, a difference of 0.10%).
| Demographics | Rating | Rank | College, 1 year or more |
| Armenians | 98.9 /100 | #75 | Exceptional 63.0% |
| Paraguayans | 98.8 /100 | #76 | Exceptional 62.9% |
| Ethiopians | 98.8 /100 | #77 | Exceptional 62.9% |
| Immigrants | Lebanon | 98.8 /100 | #78 | Exceptional 62.9% |
| Northern Europeans | 98.8 /100 | #79 | Exceptional 62.9% |
| Lithuanians | 98.8 /100 | #80 | Exceptional 62.9% |
| Laotians | 98.7 /100 | #81 | Exceptional 62.8% |
| Immigrants | Bolivia | 98.7 /100 | #82 | Exceptional 62.8% |
| Immigrants | Argentina | 98.6 /100 | #83 | Exceptional 62.8% |
| Immigrants | England | 98.6 /100 | #84 | Exceptional 62.8% |
| Immigrants | Pakistan | 98.6 /100 | #85 | Exceptional 62.8% |
| Immigrants | Western Europe | 98.6 /100 | #86 | Exceptional 62.7% |
| Immigrants | Hungary | 98.6 /100 | #87 | Exceptional 62.7% |
| Greeks | 98.3 /100 | #88 | Exceptional 62.6% |
| Immigrants | Ethiopia | 98.2 /100 | #89 | Exceptional 62.6% |