African vs Immigrants from Saudi Arabia 1st Grade
COMPARE
African
Immigrants from Saudi Arabia
1st Grade
1st Grade Comparison
Africans
Immigrants from Saudi Arabia
97.8%
1ST GRADE
16.5/ 100
METRIC RATING
207th/ 347
METRIC RANK
98.1%
1ST GRADE
93.3/ 100
METRIC RATING
127th/ 347
METRIC RANK
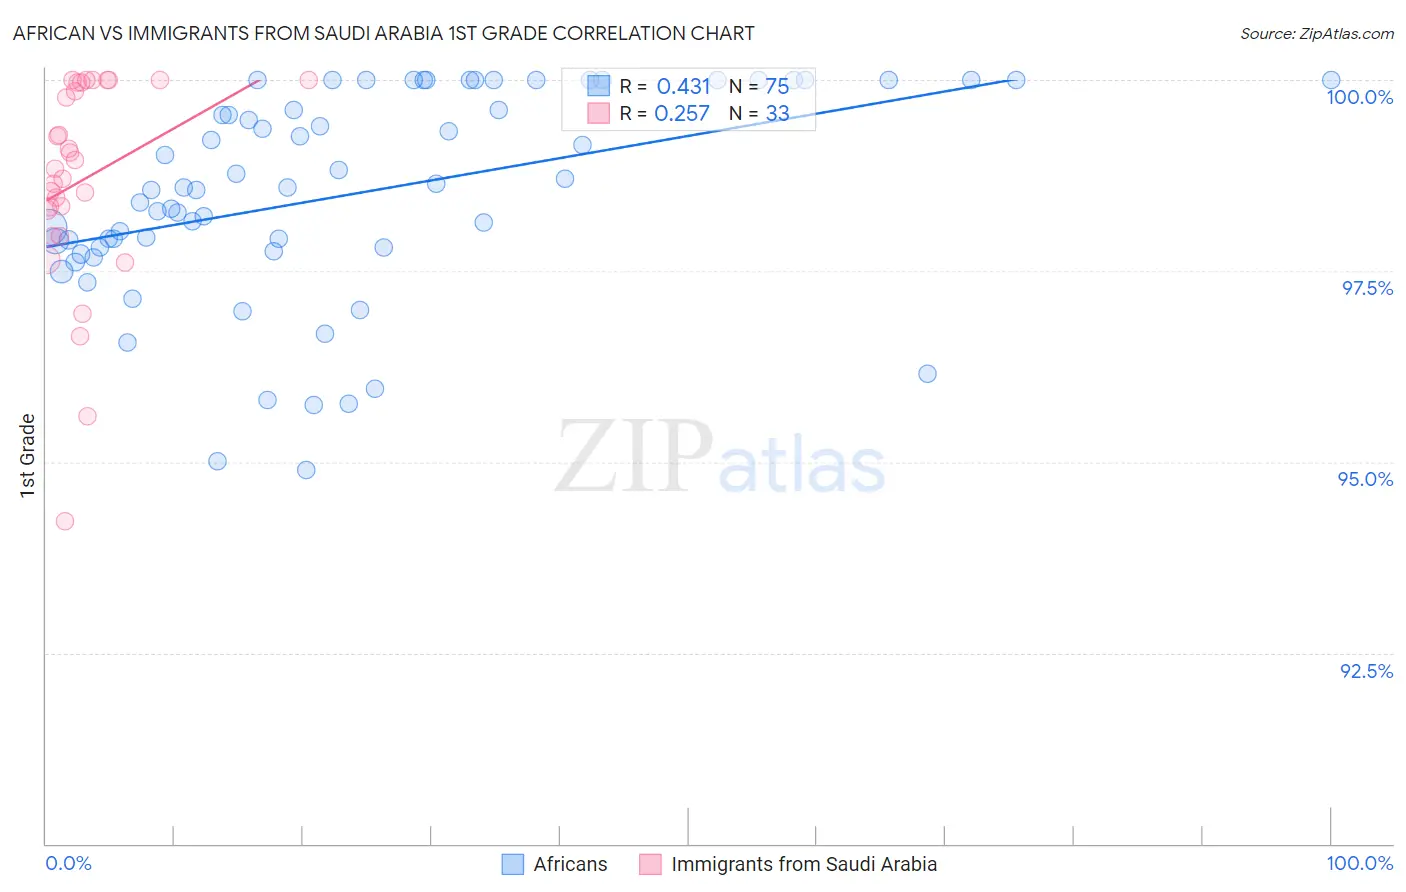
African vs Immigrants from Saudi Arabia 1st Grade Correlation Chart
The statistical analysis conducted on geographies consisting of 470,094,148 people shows a moderate positive correlation between the proportion of Africans and percentage of population with at least 1st grade education in the United States with a correlation coefficient (R) of 0.431 and weighted average of 97.8%. Similarly, the statistical analysis conducted on geographies consisting of 164,277,573 people shows a weak positive correlation between the proportion of Immigrants from Saudi Arabia and percentage of population with at least 1st grade education in the United States with a correlation coefficient (R) of 0.257 and weighted average of 98.1%, a difference of 0.33%.
1st Grade Correlation Summary
| Measurement | African | Immigrants from Saudi Arabia |
| Minimum | 94.9% | 94.2% |
| Maximum | 100.0% | 100.0% |
| Range | 5.1% | 5.8% |
| Mean | 98.5% | 98.7% |
| Median | 98.6% | 98.8% |
| Interquartile 25% (IQ1) | 97.8% | 98.1% |
| Interquartile 75% (IQ3) | 100.0% | 100.0% |
| Interquartile Range (IQR) | 2.2% | 1.8% |
| Standard Deviation (Sample) | 1.4% | 1.4% |
| Standard Deviation (Population) | 1.4% | 1.3% |
Similar Demographics by 1st Grade
Demographics Similar to Africans by 1st Grade
In terms of 1st grade, the demographic groups most similar to Africans are Immigrants from Albania (97.8%, a difference of 0.0%), Immigrants from Ukraine (97.8%, a difference of 0.010%), Immigrants from Southern Europe (97.8%, a difference of 0.010%), Immigrants from Uganda (97.8%, a difference of 0.010%), and Immigrants from Chile (97.8%, a difference of 0.010%).
| Demographics | Rating | Rank | 1st Grade |
| Immigrants | Egypt | 22.6 /100 | #200 | Fair 97.8% |
| Immigrants | Lebanon | 20.1 /100 | #201 | Fair 97.8% |
| Immigrants | Ukraine | 19.2 /100 | #202 | Poor 97.8% |
| Immigrants | Southern Europe | 18.2 /100 | #203 | Poor 97.8% |
| Immigrants | Uganda | 18.2 /100 | #204 | Poor 97.8% |
| Immigrants | Chile | 17.7 /100 | #205 | Poor 97.8% |
| Immigrants | Albania | 17.3 /100 | #206 | Poor 97.8% |
| Africans | 16.5 /100 | #207 | Poor 97.8% |
| Immigrants | Northern Africa | 12.0 /100 | #208 | Poor 97.8% |
| Costa Ricans | 11.6 /100 | #209 | Poor 97.8% |
| Immigrants | Oceania | 11.0 /100 | #210 | Poor 97.8% |
| Laotians | 10.3 /100 | #211 | Poor 97.8% |
| Moroccans | 8.7 /100 | #212 | Tragic 97.7% |
| Immigrants | Bahamas | 8.1 /100 | #213 | Tragic 97.7% |
| South American Indians | 7.6 /100 | #214 | Tragic 97.7% |
Demographics Similar to Immigrants from Saudi Arabia by 1st Grade
In terms of 1st grade, the demographic groups most similar to Immigrants from Saudi Arabia are Lebanese (98.1%, a difference of 0.0%), Immigrants from Zimbabwe (98.1%, a difference of 0.010%), Menominee (98.1%, a difference of 0.010%), Iroquois (98.1%, a difference of 0.010%), and Syrian (98.1%, a difference of 0.010%).
| Demographics | Rating | Rank | 1st Grade |
| Okinawans | 94.5 /100 | #120 | Exceptional 98.1% |
| Immigrants | Zimbabwe | 94.0 /100 | #121 | Exceptional 98.1% |
| Menominee | 93.9 /100 | #122 | Exceptional 98.1% |
| Iroquois | 93.8 /100 | #123 | Exceptional 98.1% |
| Syrians | 93.7 /100 | #124 | Exceptional 98.1% |
| Immigrants | Japan | 93.7 /100 | #125 | Exceptional 98.1% |
| Lebanese | 93.5 /100 | #126 | Exceptional 98.1% |
| Immigrants | Saudi Arabia | 93.3 /100 | #127 | Exceptional 98.1% |
| Immigrants | Serbia | 92.2 /100 | #128 | Exceptional 98.1% |
| Seminole | 91.9 /100 | #129 | Exceptional 98.1% |
| Immigrants | Croatia | 91.4 /100 | #130 | Exceptional 98.1% |
| Spaniards | 91.2 /100 | #131 | Exceptional 98.1% |
| Cambodians | 90.9 /100 | #132 | Exceptional 98.1% |
| Immigrants | Europe | 90.5 /100 | #133 | Exceptional 98.1% |
| Immigrants | Hungary | 89.4 /100 | #134 | Excellent 98.1% |