Korean vs Mexican American Indian Master's Degree
COMPARE
Korean
Mexican American Indian
Master's Degree
Master's Degree Comparison
Koreans
Mexican American Indians
14.0%
MASTER'S DEGREE
12.7/ 100
METRIC RATING
221st/ 347
METRIC RANK
11.2%
MASTER'S DEGREE
0.0/ 100
METRIC RATING
306th/ 347
METRIC RANK
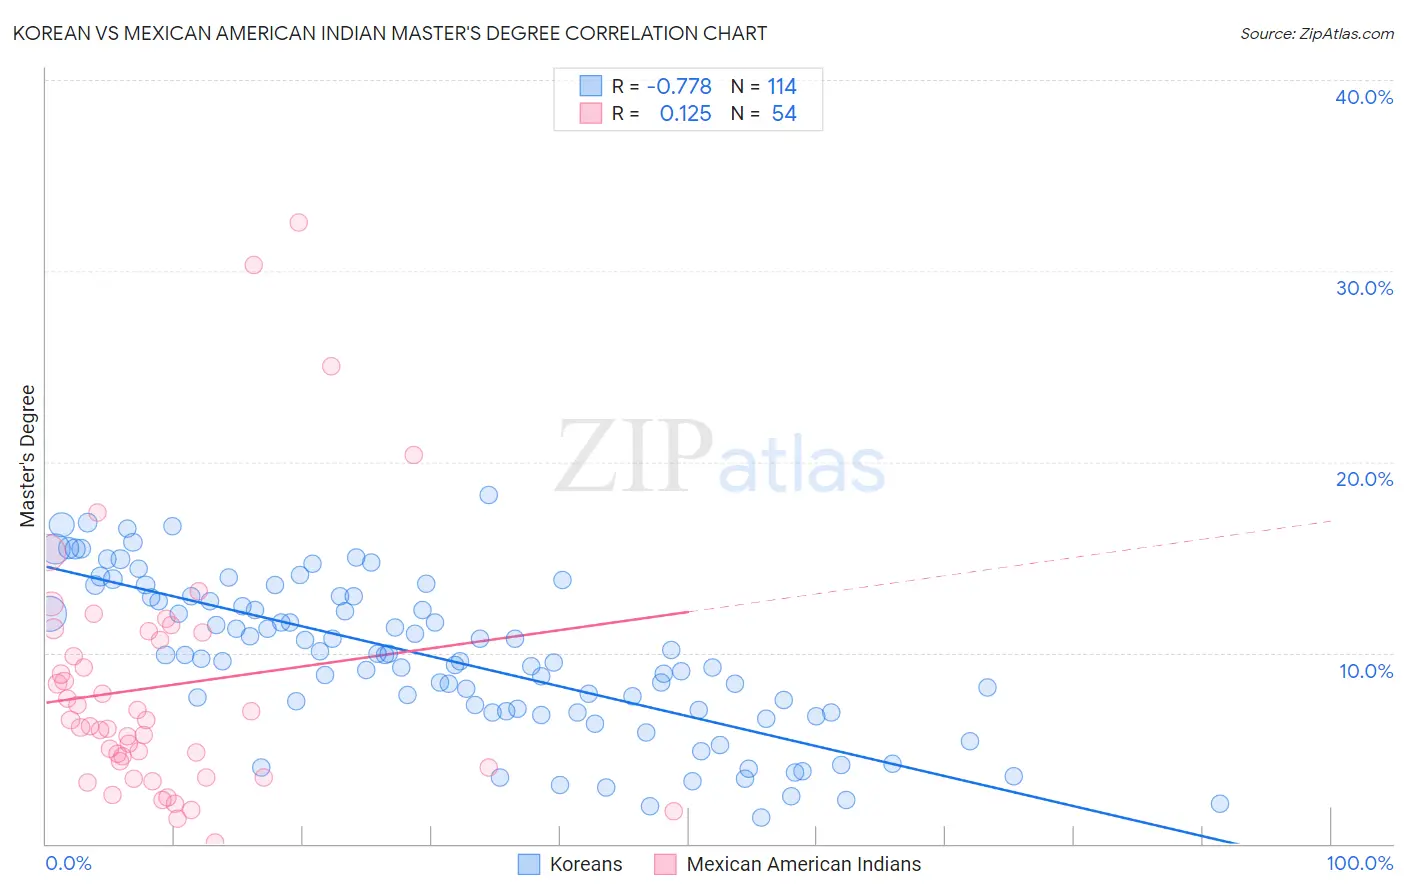
Korean vs Mexican American Indian Master's Degree Correlation Chart
The statistical analysis conducted on geographies consisting of 510,607,877 people shows a strong negative correlation between the proportion of Koreans and percentage of population with at least master's degree education in the United States with a correlation coefficient (R) of -0.778 and weighted average of 14.0%. Similarly, the statistical analysis conducted on geographies consisting of 317,480,404 people shows a poor positive correlation between the proportion of Mexican American Indians and percentage of population with at least master's degree education in the United States with a correlation coefficient (R) of 0.125 and weighted average of 11.2%, a difference of 24.5%.
Master's Degree Correlation Summary
| Measurement | Korean | Mexican American Indian |
| Minimum | 1.4% | 0.093% |
| Maximum | 18.3% | 32.5% |
| Range | 16.9% | 32.4% |
| Mean | 9.7% | 8.2% |
| Median | 9.8% | 6.3% |
| Interquartile 25% (IQ1) | 6.9% | 4.0% |
| Interquartile 75% (IQ3) | 12.9% | 11.1% |
| Interquartile Range (IQR) | 6.0% | 7.1% |
| Standard Deviation (Sample) | 4.0% | 6.7% |
| Standard Deviation (Population) | 4.0% | 6.6% |
Similar Demographics by Master's Degree
Demographics Similar to Koreans by Master's Degree
In terms of master's degree, the demographic groups most similar to Koreans are Ecuadorian (14.0%, a difference of 0.030%), German (14.0%, a difference of 0.13%), Immigrants from South Eastern Asia (14.0%, a difference of 0.23%), Immigrants from Grenada (14.0%, a difference of 0.28%), and Norwegian (14.0%, a difference of 0.29%).
| Demographics | Rating | Rank | Master's Degree |
| Finns | 16.9 /100 | #214 | Poor 14.2% |
| Immigrants | Vietnam | 16.1 /100 | #215 | Poor 14.1% |
| Immigrants | Somalia | 15.8 /100 | #216 | Poor 14.1% |
| Immigrants | Trinidad and Tobago | 15.8 /100 | #217 | Poor 14.1% |
| French Canadians | 14.9 /100 | #218 | Poor 14.1% |
| Norwegians | 13.6 /100 | #219 | Poor 14.0% |
| Germans | 13.1 /100 | #220 | Poor 14.0% |
| Koreans | 12.7 /100 | #221 | Poor 14.0% |
| Ecuadorians | 12.6 /100 | #222 | Poor 14.0% |
| Immigrants | South Eastern Asia | 11.9 /100 | #223 | Poor 14.0% |
| Immigrants | Grenada | 11.8 /100 | #224 | Poor 14.0% |
| Portuguese | 11.2 /100 | #225 | Poor 13.9% |
| Immigrants | St. Vincent and the Grenadines | 11.0 /100 | #226 | Poor 13.9% |
| Immigrants | West Indies | 9.8 /100 | #227 | Tragic 13.9% |
| Whites/Caucasians | 9.1 /100 | #228 | Tragic 13.8% |
Demographics Similar to Mexican American Indians by Master's Degree
In terms of master's degree, the demographic groups most similar to Mexican American Indians are Cheyenne (11.2%, a difference of 0.15%), Immigrants from Latin America (11.3%, a difference of 0.19%), Puerto Rican (11.2%, a difference of 0.70%), Immigrants from Cabo Verde (11.3%, a difference of 0.84%), and Puget Sound Salish (11.1%, a difference of 0.99%).
| Demographics | Rating | Rank | Master's Degree |
| Chickasaw | 0.1 /100 | #299 | Tragic 11.4% |
| Chippewa | 0.1 /100 | #300 | Tragic 11.4% |
| Tsimshian | 0.1 /100 | #301 | Tragic 11.4% |
| Cherokee | 0.1 /100 | #302 | Tragic 11.4% |
| Immigrants | Laos | 0.1 /100 | #303 | Tragic 11.4% |
| Immigrants | Cabo Verde | 0.1 /100 | #304 | Tragic 11.3% |
| Immigrants | Latin America | 0.0 /100 | #305 | Tragic 11.3% |
| Mexican American Indians | 0.0 /100 | #306 | Tragic 11.2% |
| Cheyenne | 0.0 /100 | #307 | Tragic 11.2% |
| Puerto Ricans | 0.0 /100 | #308 | Tragic 11.2% |
| Puget Sound Salish | 0.0 /100 | #309 | Tragic 11.1% |
| Shoshone | 0.0 /100 | #310 | Tragic 11.1% |
| Seminole | 0.0 /100 | #311 | Tragic 11.0% |
| Choctaw | 0.0 /100 | #312 | Tragic 11.0% |
| Yaqui | 0.0 /100 | #313 | Tragic 11.0% |