Zimbabwean vs Barbadian Self-Care Disability
COMPARE
Zimbabwean
Barbadian
Self-Care Disability
Self-Care Disability Comparison
Zimbabweans
Barbadians
2.2%
SELF-CARE DISABILITY
100.0/ 100
METRIC RATING
5th/ 347
METRIC RANK
2.7%
SELF-CARE DISABILITY
0.0/ 100
METRIC RATING
295th/ 347
METRIC RANK
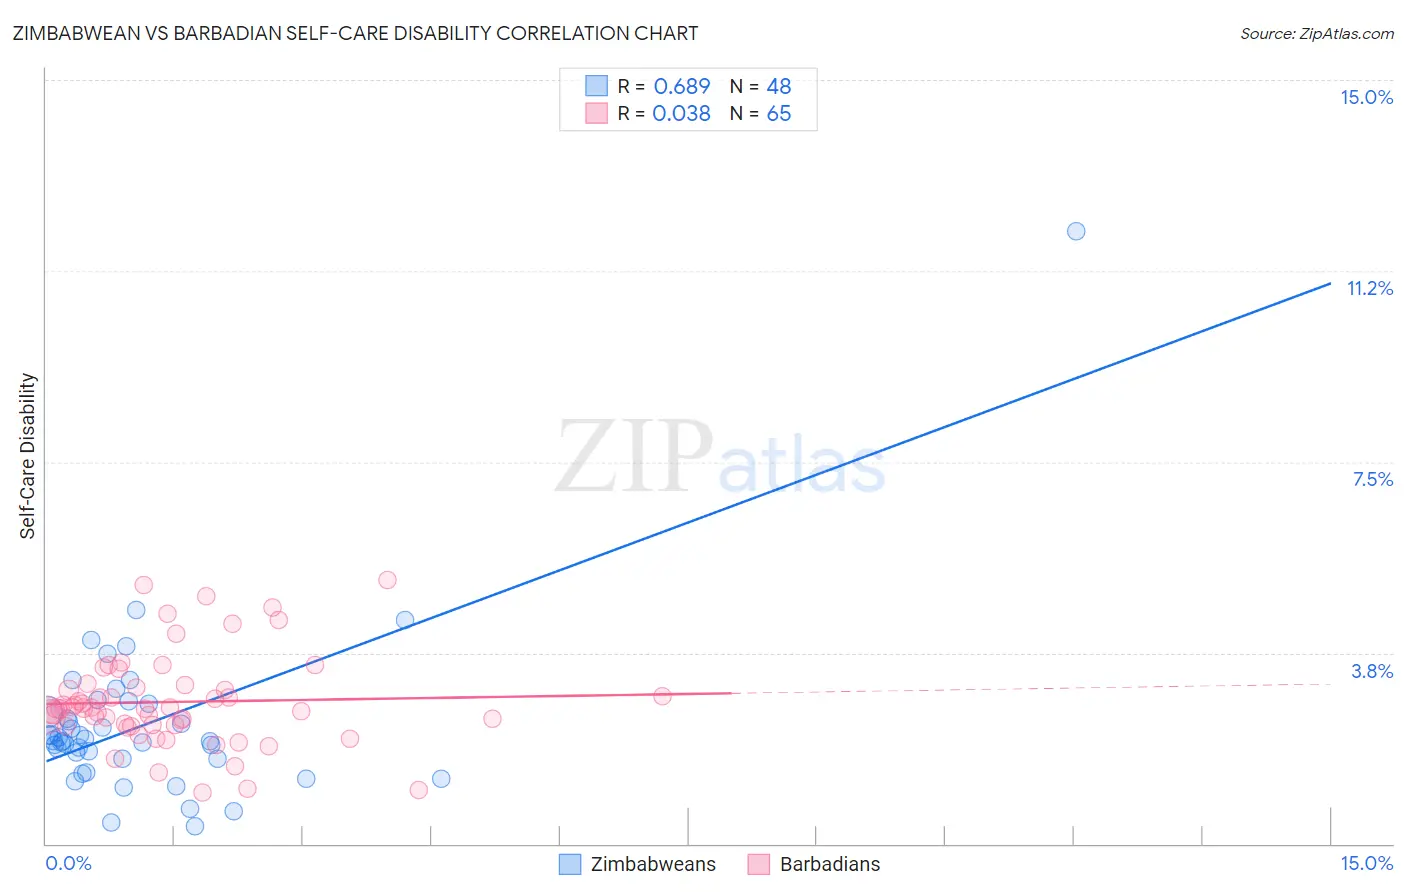
Zimbabwean vs Barbadian Self-Care Disability Correlation Chart
The statistical analysis conducted on geographies consisting of 69,189,225 people shows a significant positive correlation between the proportion of Zimbabweans and percentage of population with self-care disability in the United States with a correlation coefficient (R) of 0.689 and weighted average of 2.2%. Similarly, the statistical analysis conducted on geographies consisting of 141,243,740 people shows no correlation between the proportion of Barbadians and percentage of population with self-care disability in the United States with a correlation coefficient (R) of 0.038 and weighted average of 2.7%, a difference of 27.7%.
Self-Care Disability Correlation Summary
| Measurement | Zimbabwean | Barbadian |
| Minimum | 0.34% | 1.0% |
| Maximum | 12.0% | 5.2% |
| Range | 11.7% | 4.2% |
| Mean | 2.4% | 2.8% |
| Median | 2.0% | 2.7% |
| Interquartile 25% (IQ1) | 1.7% | 2.3% |
| Interquartile 75% (IQ3) | 2.7% | 3.1% |
| Interquartile Range (IQR) | 1.0% | 0.76% |
| Standard Deviation (Sample) | 1.7% | 0.90% |
| Standard Deviation (Population) | 1.7% | 0.90% |
Similar Demographics by Self-Care Disability
Demographics Similar to Zimbabweans by Self-Care Disability
In terms of self-care disability, the demographic groups most similar to Zimbabweans are Filipino (2.2%, a difference of 0.25%), Immigrants from Bolivia (2.2%, a difference of 0.46%), Bolivian (2.2%, a difference of 0.51%), Immigrants from Nepal (2.2%, a difference of 0.64%), and Immigrants from Singapore (2.1%, a difference of 0.98%).
| Demographics | Rating | Rank | Self-Care Disability |
| Yup'ik | 100.0 /100 | #1 | Exceptional 1.9% |
| Immigrants | India | 100.0 /100 | #2 | Exceptional 2.0% |
| Thais | 100.0 /100 | #3 | Exceptional 2.1% |
| Immigrants | Singapore | 100.0 /100 | #4 | Exceptional 2.1% |
| Zimbabweans | 100.0 /100 | #5 | Exceptional 2.2% |
| Filipinos | 100.0 /100 | #6 | Exceptional 2.2% |
| Immigrants | Bolivia | 100.0 /100 | #7 | Exceptional 2.2% |
| Bolivians | 100.0 /100 | #8 | Exceptional 2.2% |
| Immigrants | Nepal | 100.0 /100 | #9 | Exceptional 2.2% |
| Sudanese | 100.0 /100 | #10 | Exceptional 2.2% |
| Immigrants | South Central Asia | 100.0 /100 | #11 | Exceptional 2.2% |
| Immigrants | Ethiopia | 100.0 /100 | #12 | Exceptional 2.2% |
| Ethiopians | 100.0 /100 | #13 | Exceptional 2.2% |
| Luxembourgers | 100.0 /100 | #14 | Exceptional 2.2% |
| Okinawans | 100.0 /100 | #15 | Exceptional 2.2% |
Demographics Similar to Barbadians by Self-Care Disability
In terms of self-care disability, the demographic groups most similar to Barbadians are Blackfeet (2.7%, a difference of 0.14%), Central American Indian (2.7%, a difference of 0.15%), Belizean (2.7%, a difference of 0.15%), Guyanese (2.7%, a difference of 0.31%), and Immigrants from Portugal (2.8%, a difference of 0.43%).
| Demographics | Rating | Rank | Self-Care Disability |
| Immigrants | Barbados | 0.0 /100 | #288 | Tragic 2.7% |
| Africans | 0.0 /100 | #289 | Tragic 2.7% |
| Cubans | 0.0 /100 | #290 | Tragic 2.7% |
| Guyanese | 0.0 /100 | #291 | Tragic 2.7% |
| Central American Indians | 0.0 /100 | #292 | Tragic 2.7% |
| Belizeans | 0.0 /100 | #293 | Tragic 2.7% |
| Blackfeet | 0.0 /100 | #294 | Tragic 2.7% |
| Barbadians | 0.0 /100 | #295 | Tragic 2.7% |
| Immigrants | Portugal | 0.0 /100 | #296 | Tragic 2.8% |
| West Indians | 0.0 /100 | #297 | Tragic 2.8% |
| Americans | 0.0 /100 | #298 | Tragic 2.8% |
| Immigrants | Guyana | 0.0 /100 | #299 | Tragic 2.8% |
| Immigrants | Fiji | 0.0 /100 | #300 | Tragic 2.8% |
| Pima | 0.0 /100 | #301 | Tragic 2.8% |
| Immigrants | St. Vincent and the Grenadines | 0.0 /100 | #302 | Tragic 2.8% |