Yakama vs Belizean Disability Age 18 to 34
COMPARE
Yakama
Belizean
Disability Age 18 to 34
Disability Age 18 to 34 Comparison
Yakama
Belizeans
9.0%
DISABILITY AGE 18 TO 34
0.0/ 100
METRIC RATING
342nd/ 347
METRIC RANK
6.4%
DISABILITY AGE 18 TO 34
84.9/ 100
METRIC RATING
146th/ 347
METRIC RANK
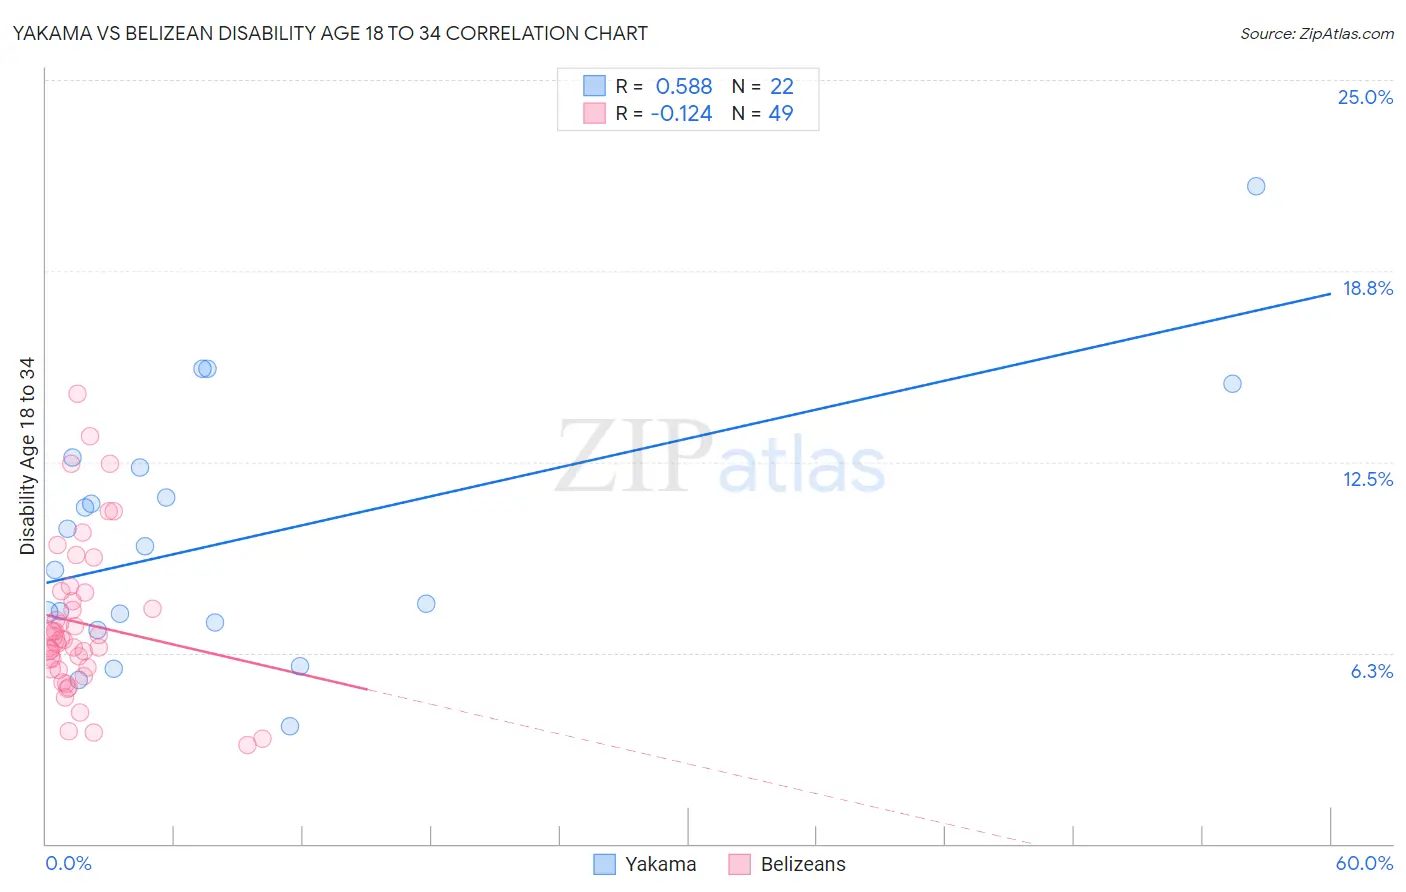
Yakama vs Belizean Disability Age 18 to 34 Correlation Chart
The statistical analysis conducted on geographies consisting of 19,906,145 people shows a substantial positive correlation between the proportion of Yakama and percentage of population with a disability between the ages 18 and 35 in the United States with a correlation coefficient (R) of 0.588 and weighted average of 9.0%. Similarly, the statistical analysis conducted on geographies consisting of 144,092,857 people shows a poor negative correlation between the proportion of Belizeans and percentage of population with a disability between the ages 18 and 35 in the United States with a correlation coefficient (R) of -0.124 and weighted average of 6.4%, a difference of 40.2%.
Disability Age 18 to 34 Correlation Summary
| Measurement | Yakama | Belizean |
| Minimum | 3.9% | 3.2% |
| Maximum | 21.5% | 14.7% |
| Range | 17.7% | 11.5% |
| Mean | 10.0% | 7.2% |
| Median | 9.3% | 6.7% |
| Interquartile 25% (IQ1) | 7.3% | 5.7% |
| Interquartile 75% (IQ3) | 12.3% | 8.2% |
| Interquartile Range (IQR) | 5.1% | 2.5% |
| Standard Deviation (Sample) | 4.2% | 2.5% |
| Standard Deviation (Population) | 4.1% | 2.5% |
Similar Demographics by Disability Age 18 to 34
Demographics Similar to Yakama by Disability Age 18 to 34
In terms of disability age 18 to 34, the demographic groups most similar to Yakama are Chippewa (9.0%, a difference of 0.010%), Chickasaw (9.0%, a difference of 0.050%), Choctaw (9.0%, a difference of 0.14%), Creek (9.0%, a difference of 0.39%), and Kiowa (8.8%, a difference of 1.6%).
| Demographics | Rating | Rank | Disability Age 18 to 34 |
| Apache | 0.0 /100 | #333 | Tragic 8.4% |
| Dutch West Indians | 0.0 /100 | #334 | Tragic 8.4% |
| Seminole | 0.0 /100 | #335 | Tragic 8.4% |
| Immigrants | Azores | 0.0 /100 | #336 | Tragic 8.5% |
| Ottawa | 0.0 /100 | #337 | Tragic 8.6% |
| Cherokee | 0.0 /100 | #338 | Tragic 8.7% |
| Kiowa | 0.0 /100 | #339 | Tragic 8.8% |
| Choctaw | 0.0 /100 | #340 | Tragic 9.0% |
| Chickasaw | 0.0 /100 | #341 | Tragic 9.0% |
| Yakama | 0.0 /100 | #342 | Tragic 9.0% |
| Chippewa | 0.0 /100 | #343 | Tragic 9.0% |
| Creek | 0.0 /100 | #344 | Tragic 9.0% |
| Alaskan Athabascans | 0.0 /100 | #345 | Tragic 9.4% |
| Houma | 0.0 /100 | #346 | Tragic 9.7% |
| Yuman | 0.0 /100 | #347 | Tragic 10.6% |
Demographics Similar to Belizeans by Disability Age 18 to 34
In terms of disability age 18 to 34, the demographic groups most similar to Belizeans are Moroccan (6.4%, a difference of 0.050%), Albanian (6.4%, a difference of 0.060%), Immigrants from South Africa (6.4%, a difference of 0.16%), Immigrants from Belgium (6.4%, a difference of 0.18%), and Immigrants from Latvia (6.4%, a difference of 0.23%).
| Demographics | Rating | Rank | Disability Age 18 to 34 |
| Immigrants | Belize | 87.4 /100 | #139 | Excellent 6.4% |
| Immigrants | Fiji | 87.3 /100 | #140 | Excellent 6.4% |
| Jamaicans | 86.8 /100 | #141 | Excellent 6.4% |
| South American Indians | 86.5 /100 | #142 | Excellent 6.4% |
| Immigrants | Latvia | 86.4 /100 | #143 | Excellent 6.4% |
| Albanians | 85.3 /100 | #144 | Excellent 6.4% |
| Moroccans | 85.2 /100 | #145 | Excellent 6.4% |
| Belizeans | 84.9 /100 | #146 | Excellent 6.4% |
| Immigrants | South Africa | 83.7 /100 | #147 | Excellent 6.4% |
| Immigrants | Belgium | 83.5 /100 | #148 | Excellent 6.4% |
| Hondurans | 83.1 /100 | #149 | Excellent 6.4% |
| Immigrants | Dominican Republic | 82.7 /100 | #150 | Excellent 6.4% |
| Tongans | 81.9 /100 | #151 | Excellent 6.4% |
| Bulgarians | 78.3 /100 | #152 | Good 6.5% |
| Immigrants | Eritrea | 77.4 /100 | #153 | Good 6.5% |