Yakama vs Immigrants from Kenya Disability Age 18 to 34
COMPARE
Yakama
Immigrants from Kenya
Disability Age 18 to 34
Disability Age 18 to 34 Comparison
Yakama
Immigrants from Kenya
9.0%
DISABILITY AGE 18 TO 34
0.0/ 100
METRIC RATING
342nd/ 347
METRIC RANK
6.9%
DISABILITY AGE 18 TO 34
6.9/ 100
METRIC RATING
217th/ 347
METRIC RANK
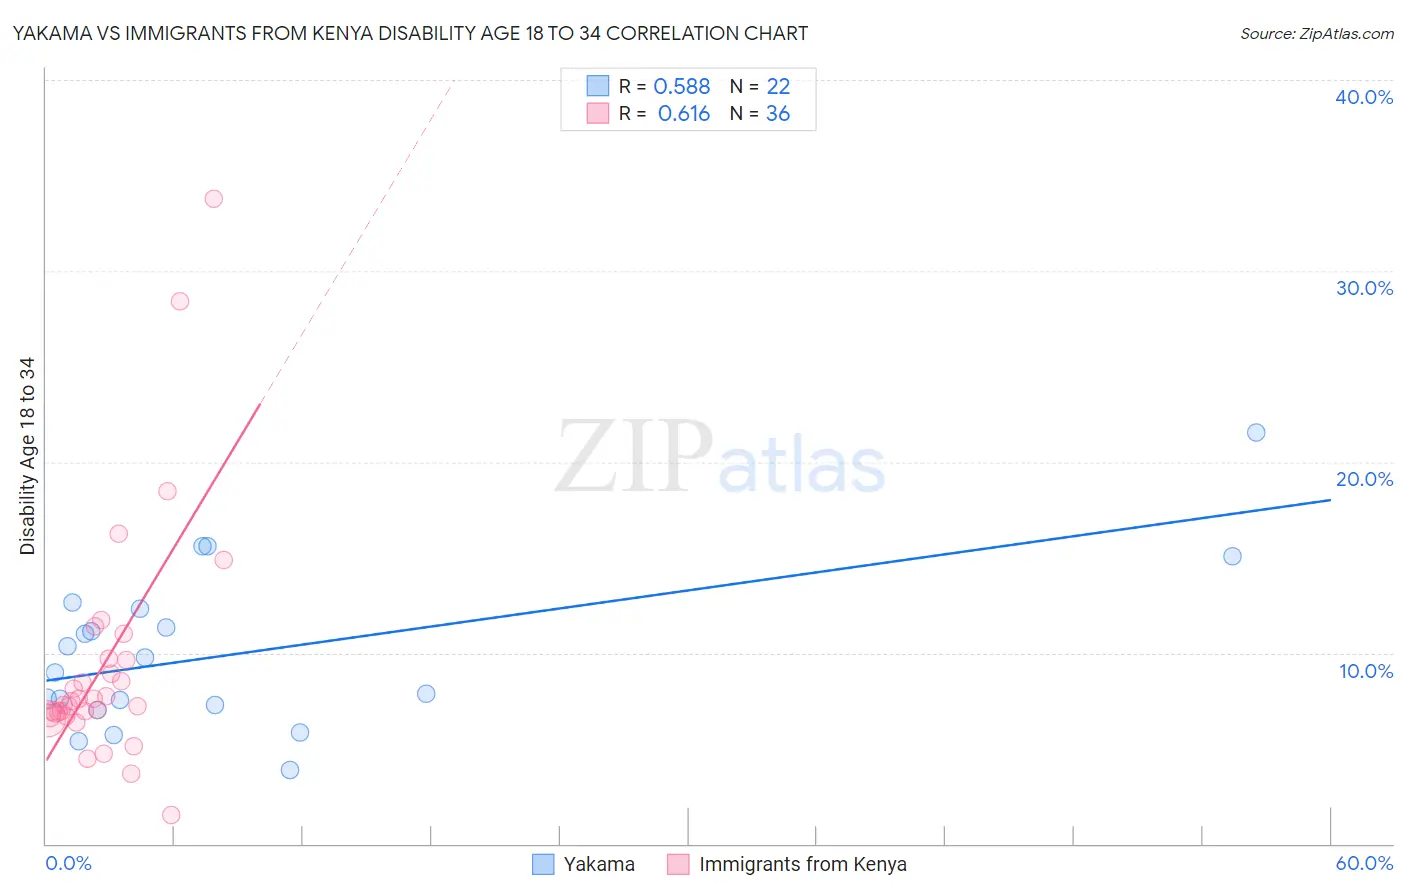
Yakama vs Immigrants from Kenya Disability Age 18 to 34 Correlation Chart
The statistical analysis conducted on geographies consisting of 19,906,145 people shows a substantial positive correlation between the proportion of Yakama and percentage of population with a disability between the ages 18 and 35 in the United States with a correlation coefficient (R) of 0.588 and weighted average of 9.0%. Similarly, the statistical analysis conducted on geographies consisting of 217,952,306 people shows a significant positive correlation between the proportion of Immigrants from Kenya and percentage of population with a disability between the ages 18 and 35 in the United States with a correlation coefficient (R) of 0.616 and weighted average of 6.9%, a difference of 30.2%.
Disability Age 18 to 34 Correlation Summary
| Measurement | Yakama | Immigrants from Kenya |
| Minimum | 3.9% | 1.5% |
| Maximum | 21.5% | 33.8% |
| Range | 17.7% | 32.3% |
| Mean | 10.0% | 9.4% |
| Median | 9.3% | 7.4% |
| Interquartile 25% (IQ1) | 7.3% | 6.8% |
| Interquartile 75% (IQ3) | 12.3% | 9.6% |
| Interquartile Range (IQR) | 5.1% | 2.8% |
| Standard Deviation (Sample) | 4.2% | 6.3% |
| Standard Deviation (Population) | 4.1% | 6.2% |
Similar Demographics by Disability Age 18 to 34
Demographics Similar to Yakama by Disability Age 18 to 34
In terms of disability age 18 to 34, the demographic groups most similar to Yakama are Chippewa (9.0%, a difference of 0.010%), Chickasaw (9.0%, a difference of 0.050%), Choctaw (9.0%, a difference of 0.14%), Creek (9.0%, a difference of 0.39%), and Kiowa (8.8%, a difference of 1.6%).
| Demographics | Rating | Rank | Disability Age 18 to 34 |
| Apache | 0.0 /100 | #333 | Tragic 8.4% |
| Dutch West Indians | 0.0 /100 | #334 | Tragic 8.4% |
| Seminole | 0.0 /100 | #335 | Tragic 8.4% |
| Immigrants | Azores | 0.0 /100 | #336 | Tragic 8.5% |
| Ottawa | 0.0 /100 | #337 | Tragic 8.6% |
| Cherokee | 0.0 /100 | #338 | Tragic 8.7% |
| Kiowa | 0.0 /100 | #339 | Tragic 8.8% |
| Choctaw | 0.0 /100 | #340 | Tragic 9.0% |
| Chickasaw | 0.0 /100 | #341 | Tragic 9.0% |
| Yakama | 0.0 /100 | #342 | Tragic 9.0% |
| Chippewa | 0.0 /100 | #343 | Tragic 9.0% |
| Creek | 0.0 /100 | #344 | Tragic 9.0% |
| Alaskan Athabascans | 0.0 /100 | #345 | Tragic 9.4% |
| Houma | 0.0 /100 | #346 | Tragic 9.7% |
| Yuman | 0.0 /100 | #347 | Tragic 10.6% |
Demographics Similar to Immigrants from Kenya by Disability Age 18 to 34
In terms of disability age 18 to 34, the demographic groups most similar to Immigrants from Kenya are Sudanese (6.9%, a difference of 0.020%), Ukrainian (6.9%, a difference of 0.050%), Hawaiian (6.9%, a difference of 0.12%), Immigrants from Thailand (6.9%, a difference of 0.15%), and Serbian (6.9%, a difference of 0.31%).
| Demographics | Rating | Rank | Disability Age 18 to 34 |
| Latvians | 11.1 /100 | #210 | Poor 6.8% |
| Immigrants | Norway | 10.0 /100 | #211 | Tragic 6.8% |
| Luxembourgers | 9.4 /100 | #212 | Tragic 6.9% |
| Immigrants | Western Europe | 9.1 /100 | #213 | Tragic 6.9% |
| Serbians | 8.2 /100 | #214 | Tragic 6.9% |
| Immigrants | Thailand | 7.5 /100 | #215 | Tragic 6.9% |
| Sudanese | 7.0 /100 | #216 | Tragic 6.9% |
| Immigrants | Kenya | 6.9 /100 | #217 | Tragic 6.9% |
| Ukrainians | 6.7 /100 | #218 | Tragic 6.9% |
| Hawaiians | 6.5 /100 | #219 | Tragic 6.9% |
| Immigrants | Senegal | 5.5 /100 | #220 | Tragic 6.9% |
| Immigrants | Middle Africa | 5.5 /100 | #221 | Tragic 6.9% |
| Immigrants | England | 5.3 /100 | #222 | Tragic 6.9% |
| Carpatho Rusyns | 5.2 /100 | #223 | Tragic 6.9% |
| Senegalese | 4.9 /100 | #224 | Tragic 6.9% |