West Indian vs Hopi Disability Age 35 to 64
COMPARE
West Indian
Hopi
Disability Age 35 to 64
Disability Age 35 to 64 Comparison
West Indians
Hopi
12.0%
DISABILITY AGE 35 TO 64
3.7/ 100
METRIC RATING
238th/ 347
METRIC RANK
13.9%
DISABILITY AGE 35 TO 64
0.0/ 100
METRIC RATING
304th/ 347
METRIC RANK
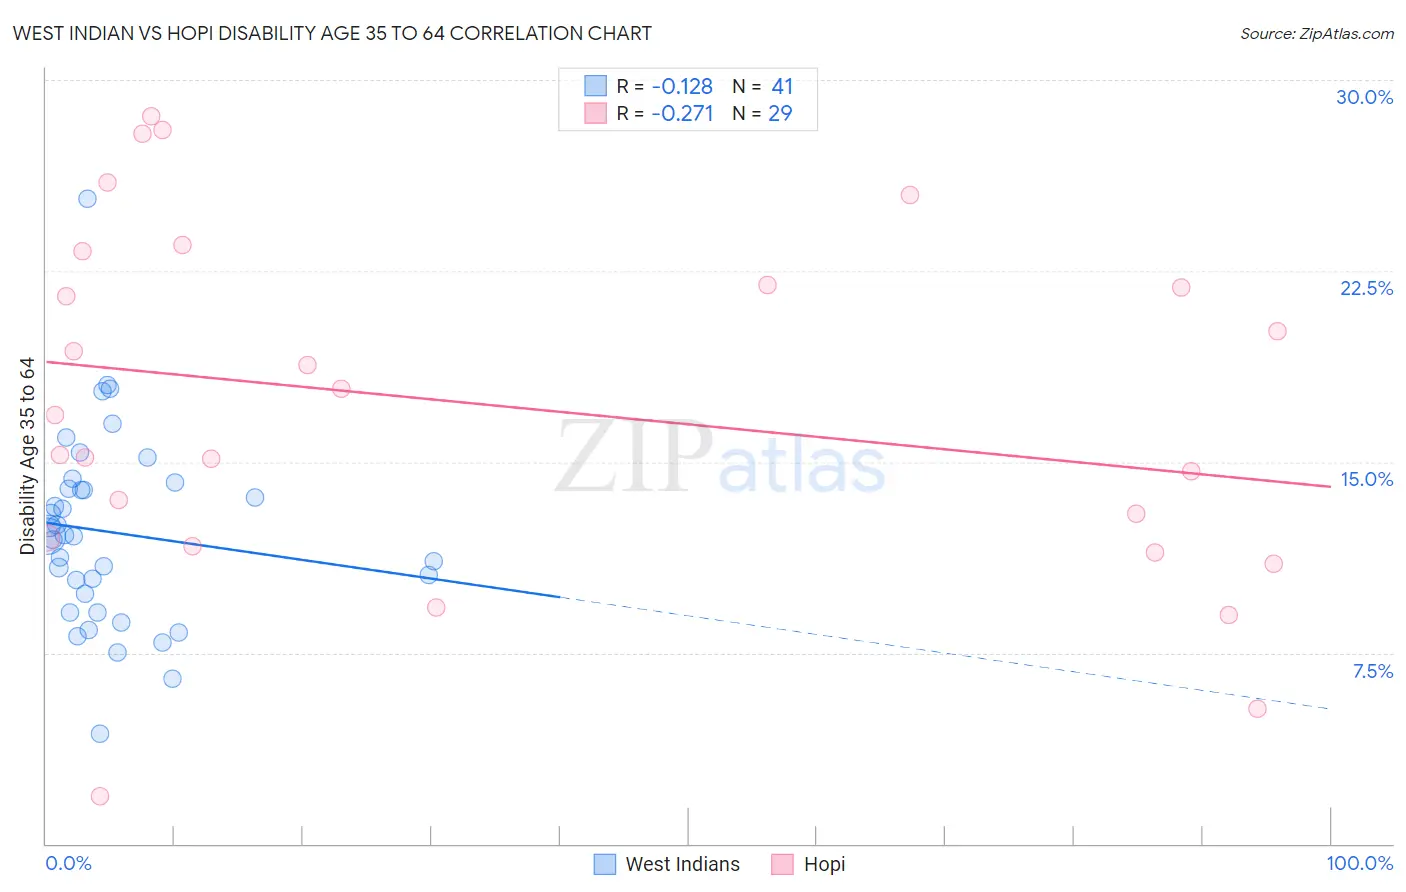
West Indian vs Hopi Disability Age 35 to 64 Correlation Chart
The statistical analysis conducted on geographies consisting of 253,855,043 people shows a poor negative correlation between the proportion of West Indians and percentage of population with a disability between the ages 34 and 64 in the United States with a correlation coefficient (R) of -0.128 and weighted average of 12.0%. Similarly, the statistical analysis conducted on geographies consisting of 74,731,125 people shows a weak negative correlation between the proportion of Hopi and percentage of population with a disability between the ages 34 and 64 in the United States with a correlation coefficient (R) of -0.271 and weighted average of 13.9%, a difference of 15.4%.
Disability Age 35 to 64 Correlation Summary
| Measurement | West Indian | Hopi |
| Minimum | 4.3% | 1.8% |
| Maximum | 25.3% | 28.6% |
| Range | 21.0% | 26.7% |
| Mean | 12.2% | 17.2% |
| Median | 12.1% | 16.9% |
| Interquartile 25% (IQ1) | 9.4% | 11.8% |
| Interquartile 75% (IQ3) | 14.1% | 22.6% |
| Interquartile Range (IQR) | 4.6% | 10.8% |
| Standard Deviation (Sample) | 3.8% | 6.9% |
| Standard Deviation (Population) | 3.7% | 6.8% |
Similar Demographics by Disability Age 35 to 64
Demographics Similar to West Indians by Disability Age 35 to 64
In terms of disability age 35 to 64, the demographic groups most similar to West Indians are Immigrants from Cambodia (12.0%, a difference of 0.10%), Immigrants from Western Africa (12.0%, a difference of 0.26%), Immigrants from Thailand (12.0%, a difference of 0.27%), Mexican American Indian (12.0%, a difference of 0.29%), and Immigrants from Middle Africa (12.0%, a difference of 0.37%).
| Demographics | Rating | Rank | Disability Age 35 to 64 |
| Jamaicans | 5.7 /100 | #231 | Tragic 11.9% |
| Sudanese | 5.3 /100 | #232 | Tragic 11.9% |
| Bermudans | 5.0 /100 | #233 | Tragic 11.9% |
| Portuguese | 4.9 /100 | #234 | Tragic 11.9% |
| Belizeans | 4.5 /100 | #235 | Tragic 12.0% |
| Immigrants | Middle Africa | 4.5 /100 | #236 | Tragic 12.0% |
| Immigrants | Cambodia | 3.9 /100 | #237 | Tragic 12.0% |
| West Indians | 3.7 /100 | #238 | Tragic 12.0% |
| Immigrants | Western Africa | 3.3 /100 | #239 | Tragic 12.0% |
| Immigrants | Thailand | 3.3 /100 | #240 | Tragic 12.0% |
| Mexican American Indians | 3.2 /100 | #241 | Tragic 12.0% |
| Samoans | 2.8 /100 | #242 | Tragic 12.1% |
| Slovaks | 2.7 /100 | #243 | Tragic 12.1% |
| Finns | 2.3 /100 | #244 | Tragic 12.1% |
| Immigrants | Mexico | 2.2 /100 | #245 | Tragic 12.1% |
Demographics Similar to Hopi by Disability Age 35 to 64
In terms of disability age 35 to 64, the demographic groups most similar to Hopi are Sioux (13.9%, a difference of 0.030%), Aleut (13.8%, a difference of 0.21%), American (13.9%, a difference of 0.38%), French American Indian (13.7%, a difference of 1.1%), and Immigrants from Yemen (14.0%, a difference of 1.3%).
| Demographics | Rating | Rank | Disability Age 35 to 64 |
| Bangladeshis | 0.0 /100 | #297 | Tragic 13.6% |
| Cheyenne | 0.0 /100 | #298 | Tragic 13.6% |
| Spanish Americans | 0.0 /100 | #299 | Tragic 13.7% |
| Delaware | 0.0 /100 | #300 | Tragic 13.7% |
| French American Indians | 0.0 /100 | #301 | Tragic 13.7% |
| Aleuts | 0.0 /100 | #302 | Tragic 13.8% |
| Sioux | 0.0 /100 | #303 | Tragic 13.9% |
| Hopi | 0.0 /100 | #304 | Tragic 13.9% |
| Americans | 0.0 /100 | #305 | Tragic 13.9% |
| Immigrants | Yemen | 0.0 /100 | #306 | Tragic 14.0% |
| Blackfeet | 0.0 /100 | #307 | Tragic 14.1% |
| Inupiat | 0.0 /100 | #308 | Tragic 14.1% |
| Cree | 0.0 /100 | #309 | Tragic 14.1% |
| Cape Verdeans | 0.0 /100 | #310 | Tragic 14.1% |
| Immigrants | Azores | 0.0 /100 | #311 | Tragic 14.3% |