West Indian vs Immigrants from South Eastern Asia Disability Age 35 to 64

COMPARE

West Indian
Race
Ancestry
AfghanAfricanAlaska NativeAlaskan AthabascanAlbanianAleutAlsatianAmericanApacheArabArapahoArgentineanArmenianAssyrian/Chaldean/SyriacAustralianAustrianBahamianBangladeshiBarbadianBasqueBelgianBelizeanBermudanBhutaneseBlackfeetBolivianBrazilianBritishBritish West IndianBulgarianBurmeseCajunCambodianCanadianCape VerdeanCarpatho RusynCelticCentral AmericanCentral American IndianCherokeeCheyenneChickasawChileanChineseChippewaChoctawColombianColvilleComancheCosta RicanCreeCreekCroatianCrowCubanCypriotCzechCzechoslovakianDanishDelawareDominicanDutchDutch West IndianEastern EuropeanEcuadorianEgyptianEnglishEstonianEthiopianEuropeanFijianFilipinoFinnishFrenchFrench American IndianFrench CanadianGermanGerman RussianGhanaianGreekGuamanian/ChamorroGuatemalanGuyaneseHaitianHmongHonduranHopiHoumaHungarianIcelanderIndian (Asian)IndonesianInupiatIranianIraqiIrishIroquoisIsraeliItalianJamaicanJapaneseJordanianKenyanKiowaKoreanLaotianLatvianLebaneseLiberianLithuanianLumbeeLuxembourgerMacedonianMalaysianMalteseMarshalleseMenomineeMexicanMexican American IndianMongolianMoroccanNative HawaiianNavajoNepaleseNew ZealanderNicaraguanNigerianNorthern EuropeanNorwegianOkinawanOsageOttawaPaiutePakistaniPalestinianPanamanianParaguayanPennsylvania GermanPeruvianPimaPolishPortuguesePotawatomiPuebloPuerto RicanPuget Sound SalishRomanianRussianSalvadoranSamoanScandinavianScotch-IrishScottishSeminoleSenegaleseSerbianShoshoneSierra LeoneanSiouxSlavicSlovakSloveneSomaliSouth AfricanSouth AmericanSouth American IndianSoviet UnionSpaniardSpanishSpanish AmericanSpanish American IndianSri LankanSubsaharan AfricanSudaneseSwedishSwissSyrianTaiwaneseThaiTlingit-HaidaTohono O'OdhamTonganTrinidadian and TobagonianTsimshianTurkishU.S. Virgin IslanderUgandanUkrainianUruguayanUteVenezuelanVietnameseWelshWest IndianYakamaYaquiYugoslavianYumanYup'ikZimbabwean
Immigration
NonimmigrantsImmigrantsAfghanistanAfricaAlbaniaArgentinaArmeniaAsiaAustraliaAustriaBahamasBangladeshBarbadosBelarusBelgiumBelizeBoliviaBosnia and HerzegovinaBrazilBulgariaBurma/MyanmarCabo VerdeCambodiaCameroonCanadaCaribbeanCentral AmericaChileChinaColombiaCongoCosta RicaCroatiaCubaCzechoslovakiaDenmarkDominicaDominican RepublicEastern AfricaEastern AsiaEastern EuropeEcuadorEgyptEl SalvadorEnglandEritreaEthiopiaEuropeFijiFranceGermanyGhanaGreeceGrenadaGuatemalaGuyanaHaitiHondurasHong KongHungaryIndiaIndonesiaIranIraqIrelandIsraelItalyJamaicaJapanJordanKazakhstanKenyaKoreaKuwaitLaosLatin AmericaLatviaLebanonLiberiaLithuaniaMalaysiaMexicoMicronesiaMiddle AfricaMoldovaMoroccoNepalNetherlandsNicaraguaNigeriaNorth AmericaNorth MacedoniaNorthern AfricaNorthern EuropeNorwayOceaniaPakistanPanamaPeruPhilippinesPolandPortugalRomaniaRussiaSaudi ArabiaScotlandSenegalSerbiaSierra LeoneSingaporeSomaliaSouth AfricaSouth AmericaSouth Central AsiaSouthern EuropeSpainSri LankaSt. Vincent and the GrenadinesSudanSwedenSwitzerlandSyriaTaiwanThailandTrinidad and TobagoTurkeyUgandaUkraineUruguayUzbekistanVenezuelaVietnamWest IndiesWestern AfricaWestern AsiaWestern EuropeYemenZaireZimbabweAzores
Immigrants from South Eastern Asia
Race
Ancestry
AfghanAfricanAlaska NativeAlaskan AthabascanAlbanianAleutAlsatianAmericanApacheArabArapahoArgentineanArmenianAssyrian/Chaldean/SyriacAustralianAustrianBahamianBangladeshiBarbadianBasqueBelgianBelizeanBermudanBhutaneseBlackfeetBolivianBrazilianBritishBritish West IndianBulgarianBurmeseCajunCambodianCanadianCape VerdeanCarpatho RusynCelticCentral AmericanCentral American IndianCherokeeCheyenneChickasawChileanChineseChippewaChoctawColombianColvilleComancheCosta RicanCreeCreekCroatianCrowCubanCypriotCzechCzechoslovakianDanishDelawareDominicanDutchDutch West IndianEastern EuropeanEcuadorianEgyptianEnglishEstonianEthiopianEuropeanFijianFilipinoFinnishFrenchFrench American IndianFrench CanadianGermanGerman RussianGhanaianGreekGuamanian/ChamorroGuatemalanGuyaneseHaitianHmongHonduranHopiHoumaHungarianIcelanderIndian (Asian)IndonesianInupiatIranianIraqiIrishIroquoisIsraeliItalianJamaicanJapaneseJordanianKenyanKiowaKoreanLaotianLatvianLebaneseLiberianLithuanianLumbeeLuxembourgerMacedonianMalaysianMalteseMarshalleseMenomineeMexicanMexican American IndianMongolianMoroccanNative HawaiianNavajoNepaleseNew ZealanderNicaraguanNigerianNorthern EuropeanNorwegianOkinawanOsageOttawaPaiutePakistaniPalestinianPanamanianParaguayanPennsylvania GermanPeruvianPimaPolishPortuguesePotawatomiPuebloPuerto RicanPuget Sound SalishRomanianRussianSalvadoranSamoanScandinavianScotch-IrishScottishSeminoleSenegaleseSerbianShoshoneSierra LeoneanSiouxSlavicSlovakSloveneSomaliSouth AfricanSouth AmericanSouth American IndianSoviet UnionSpaniardSpanishSpanish AmericanSpanish American IndianSri LankanSubsaharan AfricanSudaneseSwedishSwissSyrianTaiwaneseThaiTlingit-HaidaTohono O'OdhamTonganTrinidadian and TobagonianTsimshianTurkishU.S. Virgin IslanderUgandanUkrainianUruguayanUteVenezuelanVietnameseWelshYakamaYaquiYugoslavianYumanYup'ikZimbabwean
Immigration
NonimmigrantsImmigrantsAfghanistanAfricaAlbaniaArgentinaArmeniaAsiaAustraliaAustriaBahamasBangladeshBarbadosBelarusBelgiumBelizeBoliviaBosnia and HerzegovinaBrazilBulgariaBurma/MyanmarCabo VerdeCambodiaCameroonCanadaCaribbeanCentral AmericaChileChinaColombiaCongoCosta RicaCroatiaCubaCzechoslovakiaDenmarkDominicaDominican RepublicEastern AfricaEastern AsiaEastern EuropeEcuadorEgyptEl SalvadorEnglandEritreaEthiopiaEuropeFijiFranceGermanyGhanaGreeceGrenadaGuatemalaGuyanaHaitiHondurasHong KongHungaryIndiaIndonesiaIranIraqIrelandIsraelItalyJamaicaJapanJordanKazakhstanKenyaKoreaKuwaitLaosLatin AmericaLatviaLebanonLiberiaLithuaniaMalaysiaMexicoMicronesiaMiddle AfricaMoldovaMoroccoNepalNetherlandsNicaraguaNigeriaNorth AmericaNorth MacedoniaNorthern AfricaNorthern EuropeNorwayOceaniaPakistanPanamaPeruPhilippinesPolandPortugalRomaniaRussiaSaudi ArabiaScotlandSenegalSerbiaSierra LeoneSingaporeSomaliaSouth AfricaSouth AmericaSouth Central AsiaSouth Eastern AsiaSouthern EuropeSpainSri LankaSt. Vincent and the GrenadinesSudanSwedenSwitzerlandSyriaTaiwanThailandTrinidad and TobagoTurkeyUgandaUkraineUruguayUzbekistanVenezuelaVietnamWest IndiesWestern AfricaWestern AsiaWestern EuropeYemenZaireZimbabweAzores
Disability Age 35 to 64
Income
Poverty
Unemployment
Labor Participation
Family Structure
Vehicle Availability
Education Level
Disability

Disability Age 35 to 64 Comparison

West Indians

Immigrants from South Eastern Asia

Tragic
Exceptional
12.0%
DISABILITY AGE 35 TO 64
3.7/ 100
METRIC RATING
238th/ 347
METRIC RANK
10.6%
DISABILITY AGE 35 TO 64
95.7/ 100
METRIC RATING
117th/ 347
METRIC RANK

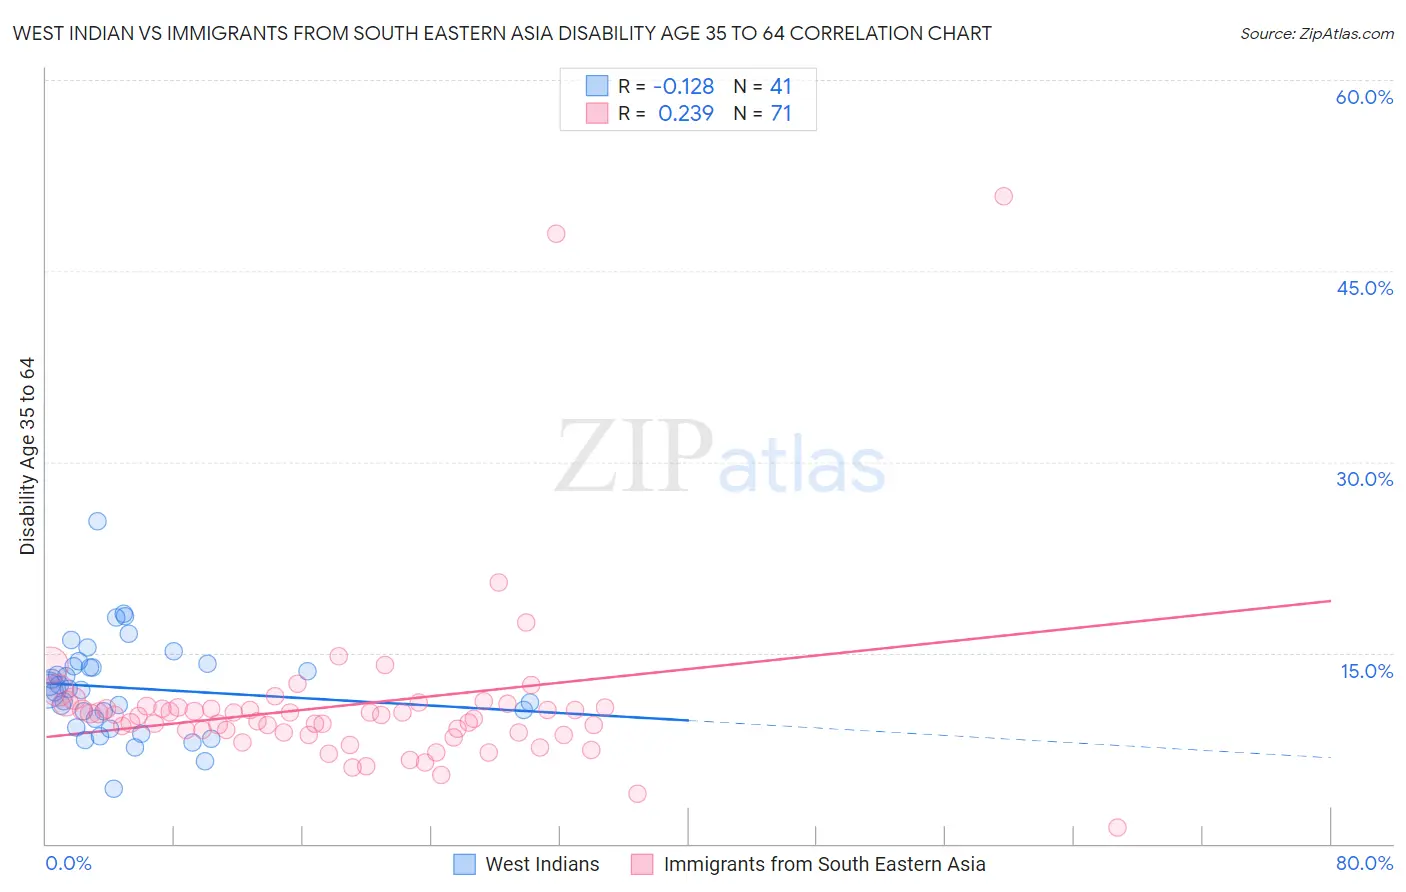
West Indian vs Immigrants from South Eastern Asia Disability Age 35 to 64 Correlation Chart

The statistical analysis conducted on geographies consisting of 253,855,043 people shows a poor negative correlation between the proportion of West Indians and percentage of population with a disability between the ages 34 and 64 in the United States with a correlation coefficient (R) of -0.128 and weighted average of 12.0%. Similarly, the statistical analysis conducted on geographies consisting of 512,104,906 people shows a weak positive correlation between the proportion of Immigrants from South Eastern Asia and percentage of population with a disability between the ages 34 and 64 in the United States with a correlation coefficient (R) of 0.239 and weighted average of 10.6%, a difference of 13.6%.
West Indian vs Immigrants from South Eastern Asia Disability Age 35 to 64

Disability Age 35 to 64 Correlation Summary

MeasurementWest IndianImmigrants from South Eastern Asia
Minimum4.3%1.3%
Maximum25.3%50.9%
Range21.0%49.6%
Mean12.2%10.9%
Median12.1%10.1%
Interquartile 25% (IQ1)9.4%8.7%
Interquartile 75% (IQ3)14.1%10.7%
Interquartile Range (IQR)4.6%2.0%
Standard Deviation (Sample)3.8%7.1%
Standard Deviation (Population)3.7%7.1%

Similar Demographics by Disability Age 35 to 64

Demographics Similar to West Indians by Disability Age 35 to 64

In terms of disability age 35 to 64, the demographic groups most similar to West Indians are Immigrants from Cambodia (12.0%, a difference of 0.10%), Immigrants from Western Africa (12.0%, a difference of 0.26%), Immigrants from Thailand (12.0%, a difference of 0.27%), Mexican American Indian (12.0%, a difference of 0.29%), and Immigrants from Middle Africa (12.0%, a difference of 0.37%).
DemographicsRating | RankDisability Age 35 to 64
Jamaicans
5.7
/100
|
#231
Tragic
11.9%
Sudanese
5.3
/100
|
#232
Tragic
11.9%
Bermudans
5.0
/100
|
#233
Tragic
11.9%
Portuguese
4.9
/100
|
#234
Tragic
11.9%
Belizeans
4.5
/100
|
#235
Tragic
12.0%
Immigrants | Middle Africa
4.5
/100
|
#236
Tragic
12.0%
Immigrants | Cambodia
3.9
/100
|
#237
Tragic
12.0%
West Indians
3.7
/100
|
#238
Tragic
12.0%
Immigrants | Western Africa
3.3
/100
|
#239
Tragic
12.0%
Immigrants | Thailand
3.3
/100
|
#240
Tragic
12.0%
Mexican American Indians
3.2
/100
|
#241
Tragic
12.0%
Samoans
2.8
/100
|
#242
Tragic
12.1%
Slovaks
2.7
/100
|
#243
Tragic
12.1%
Finns
2.3
/100
|
#244
Tragic
12.1%
Immigrants | Mexico
2.2
/100
|
#245
Tragic
12.1%

Demographics Similar to Immigrants from South Eastern Asia by Disability Age 35 to 64

In terms of disability age 35 to 64, the demographic groups most similar to Immigrants from South Eastern Asia are Immigrants from Moldova (10.6%, a difference of 0.090%), Immigrants from Nepal (10.6%, a difference of 0.10%), Luxembourger (10.6%, a difference of 0.14%), Vietnamese (10.6%, a difference of 0.16%), and Immigrants from Netherlands (10.5%, a difference of 0.33%).
DemographicsRating | RankDisability Age 35 to 64
Koreans
97.1
/100
|
#110
Exceptional
10.5%
Brazilians
96.9
/100
|
#111
Exceptional
10.5%
Assyrians/Chaldeans/Syriacs
96.8
/100
|
#112
Exceptional
10.5%
Tongans
96.6
/100
|
#113
Exceptional
10.5%
Immigrants | Morocco
96.6
/100
|
#114
Exceptional
10.5%
Immigrants | Netherlands
96.3
/100
|
#115
Exceptional
10.5%
Immigrants | Nepal
95.9
/100
|
#116
Exceptional
10.6%
Immigrants | South Eastern Asia
95.7
/100
|
#117
Exceptional
10.6%
Immigrants | Moldova
95.5
/100
|
#118
Exceptional
10.6%
Luxembourgers
95.5
/100
|
#119
Exceptional
10.6%
Vietnamese
95.4
/100
|
#120
Exceptional
10.6%
Romanians
95.0
/100
|
#121
Exceptional
10.6%
Immigrants | Norway
95.0
/100
|
#122
Exceptional
10.6%
Maltese
94.8
/100
|
#123
Exceptional
10.6%
Estonians
94.5
/100
|
#124
Exceptional
10.6%