Nonimmigrants vs Hopi Disability Age 35 to 64
COMPARE
Nonimmigrants
Hopi
Disability Age 35 to 64
Disability Age 35 to 64 Comparison
Nonimmigrants
Hopi
13.0%
DISABILITY AGE 35 TO 64
0.0/ 100
METRIC RATING
284th/ 347
METRIC RANK
13.9%
DISABILITY AGE 35 TO 64
0.0/ 100
METRIC RATING
304th/ 347
METRIC RANK
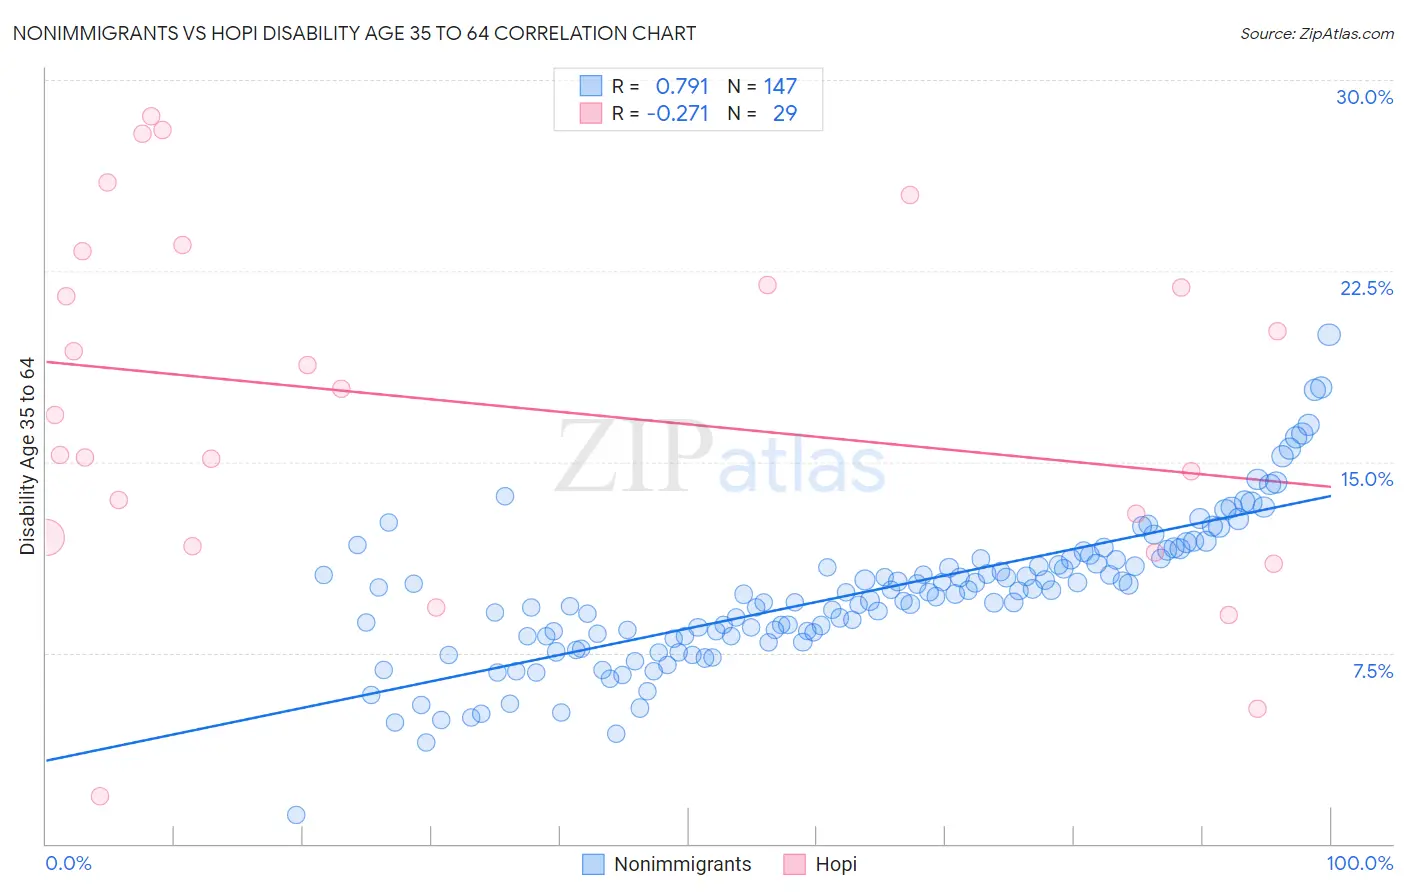
Nonimmigrants vs Hopi Disability Age 35 to 64 Correlation Chart
The statistical analysis conducted on geographies consisting of 583,562,173 people shows a strong positive correlation between the proportion of Nonimmigrants and percentage of population with a disability between the ages 34 and 64 in the United States with a correlation coefficient (R) of 0.791 and weighted average of 13.0%. Similarly, the statistical analysis conducted on geographies consisting of 74,731,125 people shows a weak negative correlation between the proportion of Hopi and percentage of population with a disability between the ages 34 and 64 in the United States with a correlation coefficient (R) of -0.271 and weighted average of 13.9%, a difference of 6.3%.
Disability Age 35 to 64 Correlation Summary
| Measurement | Nonimmigrants | Hopi |
| Minimum | 1.1% | 1.8% |
| Maximum | 20.0% | 28.6% |
| Range | 18.9% | 26.7% |
| Mean | 9.8% | 17.2% |
| Median | 9.8% | 16.9% |
| Interquartile 25% (IQ1) | 8.1% | 11.8% |
| Interquartile 75% (IQ3) | 11.2% | 22.6% |
| Interquartile Range (IQR) | 3.1% | 10.8% |
| Standard Deviation (Sample) | 2.9% | 6.9% |
| Standard Deviation (Population) | 2.9% | 6.8% |
Demographics Similar to Nonimmigrants and Hopi by Disability Age 35 to 64
In terms of disability age 35 to 64, the demographic groups most similar to Nonimmigrants are Immigrants from Somalia (13.1%, a difference of 0.44%), Hmong (13.1%, a difference of 0.75%), Tlingit-Haida (13.2%, a difference of 1.0%), Fijian (13.2%, a difference of 1.4%), and Indonesian (13.2%, a difference of 1.5%). Similarly, the demographic groups most similar to Hopi are Sioux (13.9%, a difference of 0.030%), Aleut (13.8%, a difference of 0.21%), French American Indian (13.7%, a difference of 1.1%), Delaware (13.7%, a difference of 1.4%), and Spanish American (13.7%, a difference of 1.5%).
| Demographics | Rating | Rank | Disability Age 35 to 64 |
| Immigrants | Nonimmigrants | 0.0 /100 | #284 | Tragic 13.0% |
| Immigrants | Somalia | 0.0 /100 | #285 | Tragic 13.1% |
| Hmong | 0.0 /100 | #286 | Tragic 13.1% |
| Tlingit-Haida | 0.0 /100 | #287 | Tragic 13.2% |
| Fijians | 0.0 /100 | #288 | Tragic 13.2% |
| Indonesians | 0.0 /100 | #289 | Tragic 13.2% |
| Immigrants | Liberia | 0.0 /100 | #290 | Tragic 13.2% |
| Immigrants | Congo | 0.0 /100 | #291 | Tragic 13.3% |
| Puget Sound Salish | 0.0 /100 | #292 | Tragic 13.3% |
| Ute | 0.0 /100 | #293 | Tragic 13.4% |
| Yaqui | 0.0 /100 | #294 | Tragic 13.5% |
| Yakama | 0.0 /100 | #295 | Tragic 13.6% |
| Africans | 0.0 /100 | #296 | Tragic 13.6% |
| Bangladeshis | 0.0 /100 | #297 | Tragic 13.6% |
| Cheyenne | 0.0 /100 | #298 | Tragic 13.6% |
| Spanish Americans | 0.0 /100 | #299 | Tragic 13.7% |
| Delaware | 0.0 /100 | #300 | Tragic 13.7% |
| French American Indians | 0.0 /100 | #301 | Tragic 13.7% |
| Aleuts | 0.0 /100 | #302 | Tragic 13.8% |
| Sioux | 0.0 /100 | #303 | Tragic 13.9% |
| Hopi | 0.0 /100 | #304 | Tragic 13.9% |