Immigrants from Ethiopia vs Hopi Disability Age 35 to 64
COMPARE
Immigrants from Ethiopia
Hopi
Disability Age 35 to 64
Disability Age 35 to 64 Comparison
Immigrants from Ethiopia
Hopi
10.5%
DISABILITY AGE 35 TO 64
97.2/ 100
METRIC RATING
109th/ 347
METRIC RANK
13.9%
DISABILITY AGE 35 TO 64
0.0/ 100
METRIC RATING
304th/ 347
METRIC RANK
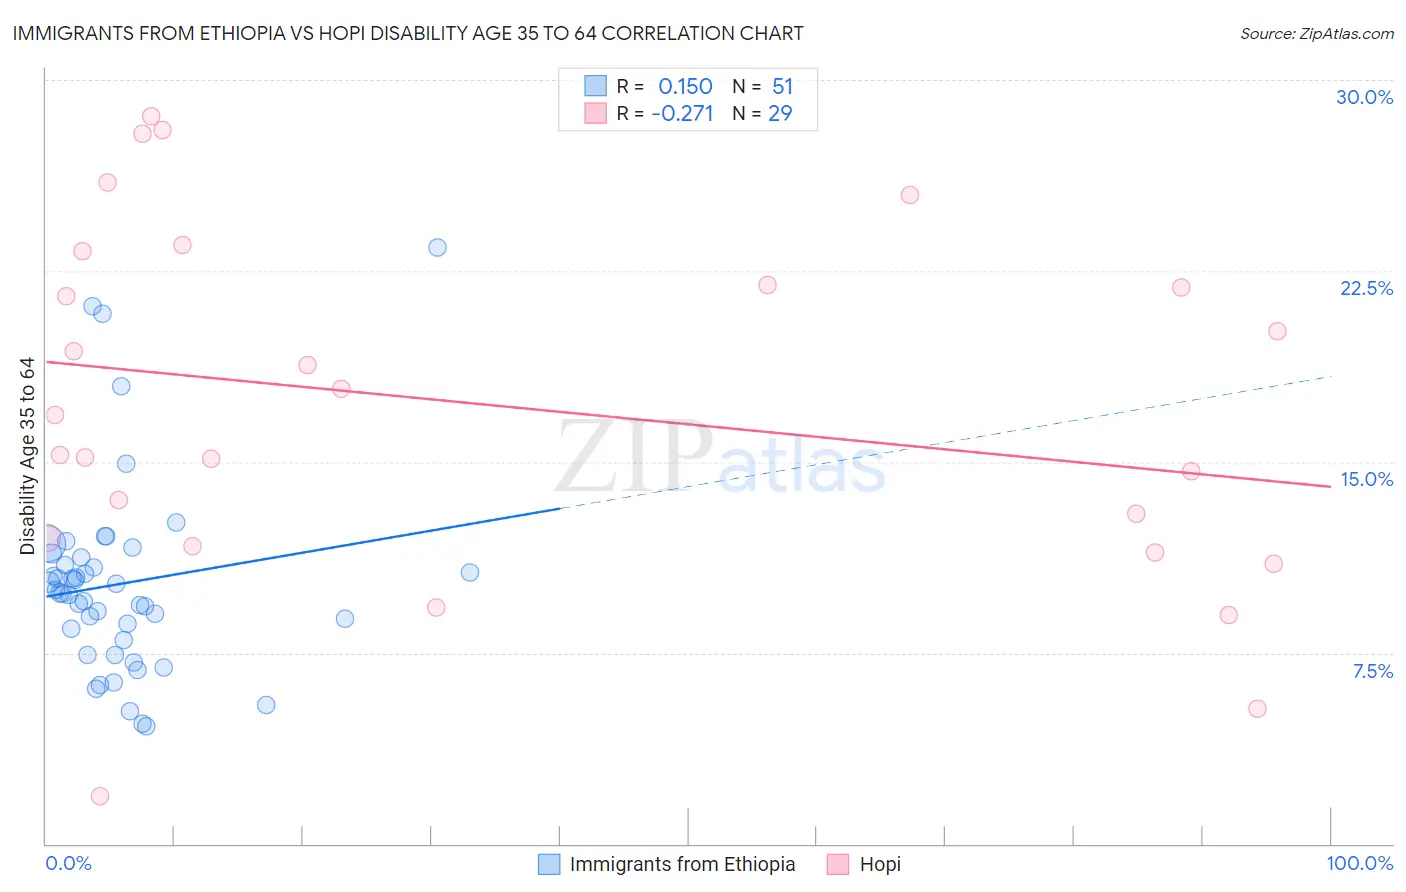
Immigrants from Ethiopia vs Hopi Disability Age 35 to 64 Correlation Chart
The statistical analysis conducted on geographies consisting of 211,448,836 people shows a poor positive correlation between the proportion of Immigrants from Ethiopia and percentage of population with a disability between the ages 34 and 64 in the United States with a correlation coefficient (R) of 0.150 and weighted average of 10.5%. Similarly, the statistical analysis conducted on geographies consisting of 74,731,125 people shows a weak negative correlation between the proportion of Hopi and percentage of population with a disability between the ages 34 and 64 in the United States with a correlation coefficient (R) of -0.271 and weighted average of 13.9%, a difference of 32.4%.
Disability Age 35 to 64 Correlation Summary
| Measurement | Immigrants from Ethiopia | Hopi |
| Minimum | 4.6% | 1.8% |
| Maximum | 23.4% | 28.6% |
| Range | 18.8% | 26.7% |
| Mean | 10.2% | 17.2% |
| Median | 9.9% | 16.9% |
| Interquartile 25% (IQ1) | 8.0% | 11.8% |
| Interquartile 75% (IQ3) | 11.2% | 22.6% |
| Interquartile Range (IQR) | 3.2% | 10.8% |
| Standard Deviation (Sample) | 3.8% | 6.9% |
| Standard Deviation (Population) | 3.8% | 6.8% |
Similar Demographics by Disability Age 35 to 64
Demographics Similar to Immigrants from Ethiopia by Disability Age 35 to 64
In terms of disability age 35 to 64, the demographic groups most similar to Immigrants from Ethiopia are Korean (10.5%, a difference of 0.060%), Ethiopian (10.5%, a difference of 0.14%), Zimbabwean (10.4%, a difference of 0.15%), Brazilian (10.5%, a difference of 0.27%), and Assyrian/Chaldean/Syriac (10.5%, a difference of 0.30%).
| Demographics | Rating | Rank | Disability Age 35 to 64 |
| Immigrants | Western Asia | 98.0 /100 | #102 | Exceptional 10.4% |
| Immigrants | Ukraine | 97.9 /100 | #103 | Exceptional 10.4% |
| Immigrants | Austria | 97.8 /100 | #104 | Exceptional 10.4% |
| Macedonians | 97.8 /100 | #105 | Exceptional 10.4% |
| Immigrants | Hungary | 97.6 /100 | #106 | Exceptional 10.4% |
| Zimbabweans | 97.4 /100 | #107 | Exceptional 10.4% |
| Ethiopians | 97.4 /100 | #108 | Exceptional 10.5% |
| Immigrants | Ethiopia | 97.2 /100 | #109 | Exceptional 10.5% |
| Koreans | 97.1 /100 | #110 | Exceptional 10.5% |
| Brazilians | 96.9 /100 | #111 | Exceptional 10.5% |
| Assyrians/Chaldeans/Syriacs | 96.8 /100 | #112 | Exceptional 10.5% |
| Tongans | 96.6 /100 | #113 | Exceptional 10.5% |
| Immigrants | Morocco | 96.6 /100 | #114 | Exceptional 10.5% |
| Immigrants | Netherlands | 96.3 /100 | #115 | Exceptional 10.5% |
| Immigrants | Nepal | 95.9 /100 | #116 | Exceptional 10.6% |
Demographics Similar to Hopi by Disability Age 35 to 64
In terms of disability age 35 to 64, the demographic groups most similar to Hopi are Sioux (13.9%, a difference of 0.030%), Aleut (13.8%, a difference of 0.21%), American (13.9%, a difference of 0.38%), French American Indian (13.7%, a difference of 1.1%), and Immigrants from Yemen (14.0%, a difference of 1.3%).
| Demographics | Rating | Rank | Disability Age 35 to 64 |
| Bangladeshis | 0.0 /100 | #297 | Tragic 13.6% |
| Cheyenne | 0.0 /100 | #298 | Tragic 13.6% |
| Spanish Americans | 0.0 /100 | #299 | Tragic 13.7% |
| Delaware | 0.0 /100 | #300 | Tragic 13.7% |
| French American Indians | 0.0 /100 | #301 | Tragic 13.7% |
| Aleuts | 0.0 /100 | #302 | Tragic 13.8% |
| Sioux | 0.0 /100 | #303 | Tragic 13.9% |
| Hopi | 0.0 /100 | #304 | Tragic 13.9% |
| Americans | 0.0 /100 | #305 | Tragic 13.9% |
| Immigrants | Yemen | 0.0 /100 | #306 | Tragic 14.0% |
| Blackfeet | 0.0 /100 | #307 | Tragic 14.1% |
| Inupiat | 0.0 /100 | #308 | Tragic 14.1% |
| Cree | 0.0 /100 | #309 | Tragic 14.1% |
| Cape Verdeans | 0.0 /100 | #310 | Tragic 14.1% |
| Immigrants | Azores | 0.0 /100 | #311 | Tragic 14.3% |