West Indian vs Immigrants from Lebanon Disability Age 35 to 64
COMPARE
West Indian
Immigrants from Lebanon
Disability Age 35 to 64
Disability Age 35 to 64 Comparison
West Indians
Immigrants from Lebanon
12.0%
DISABILITY AGE 35 TO 64
3.7/ 100
METRIC RATING
238th/ 347
METRIC RANK
10.3%
DISABILITY AGE 35 TO 64
98.9/ 100
METRIC RATING
91st/ 347
METRIC RANK
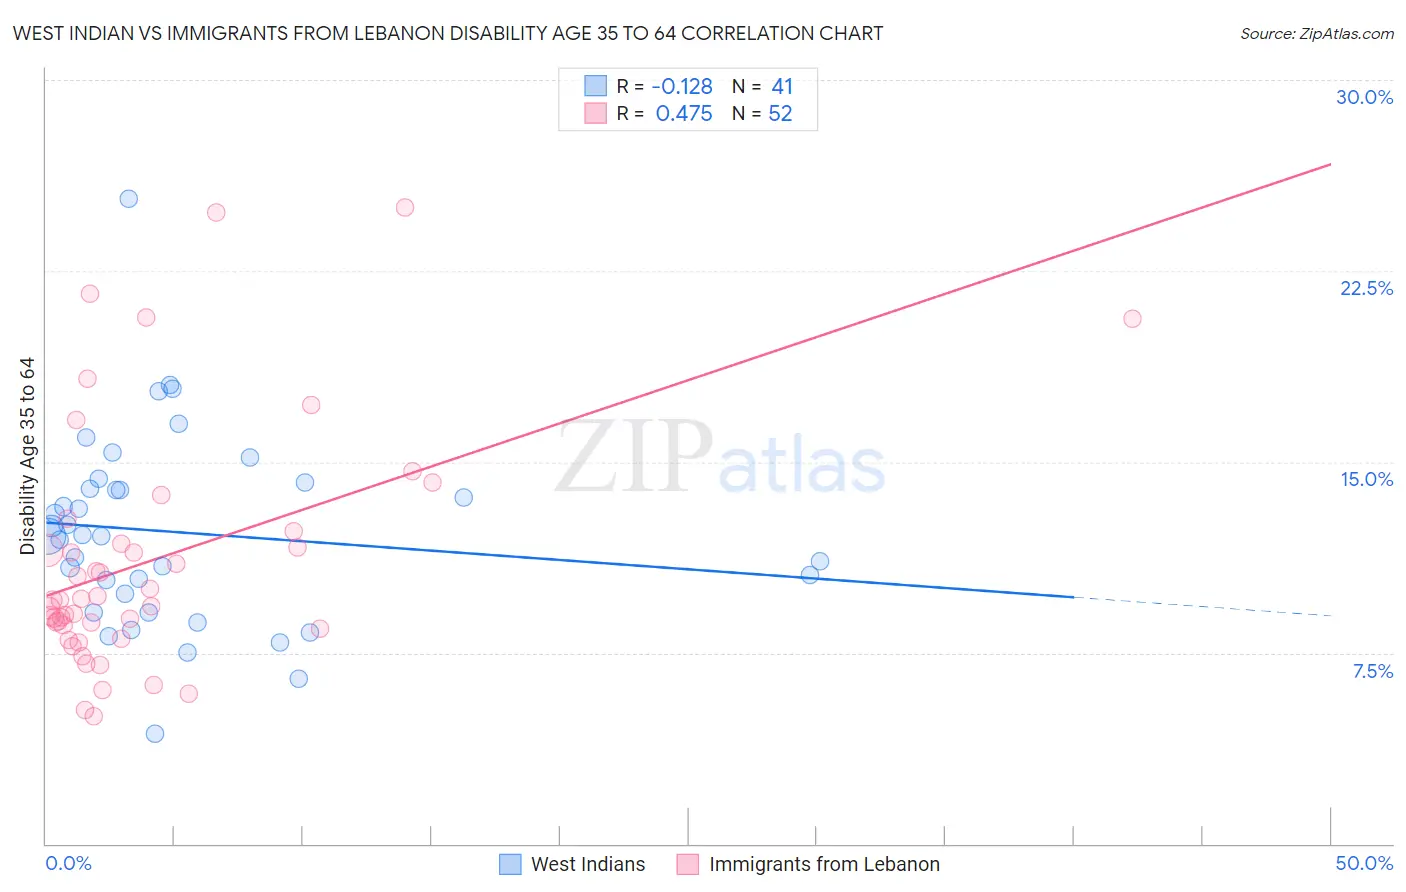
West Indian vs Immigrants from Lebanon Disability Age 35 to 64 Correlation Chart
The statistical analysis conducted on geographies consisting of 253,855,043 people shows a poor negative correlation between the proportion of West Indians and percentage of population with a disability between the ages 34 and 64 in the United States with a correlation coefficient (R) of -0.128 and weighted average of 12.0%. Similarly, the statistical analysis conducted on geographies consisting of 217,113,313 people shows a moderate positive correlation between the proportion of Immigrants from Lebanon and percentage of population with a disability between the ages 34 and 64 in the United States with a correlation coefficient (R) of 0.475 and weighted average of 10.3%, a difference of 17.1%.
Disability Age 35 to 64 Correlation Summary
| Measurement | West Indian | Immigrants from Lebanon |
| Minimum | 4.3% | 5.0% |
| Maximum | 25.3% | 25.0% |
| Range | 21.0% | 20.0% |
| Mean | 12.2% | 11.1% |
| Median | 12.1% | 9.6% |
| Interquartile 25% (IQ1) | 9.4% | 8.5% |
| Interquartile 75% (IQ3) | 14.1% | 12.0% |
| Interquartile Range (IQR) | 4.6% | 3.5% |
| Standard Deviation (Sample) | 3.8% | 4.7% |
| Standard Deviation (Population) | 3.7% | 4.7% |
Similar Demographics by Disability Age 35 to 64
Demographics Similar to West Indians by Disability Age 35 to 64
In terms of disability age 35 to 64, the demographic groups most similar to West Indians are Immigrants from Cambodia (12.0%, a difference of 0.10%), Immigrants from Western Africa (12.0%, a difference of 0.26%), Immigrants from Thailand (12.0%, a difference of 0.27%), Mexican American Indian (12.0%, a difference of 0.29%), and Immigrants from Middle Africa (12.0%, a difference of 0.37%).
| Demographics | Rating | Rank | Disability Age 35 to 64 |
| Jamaicans | 5.7 /100 | #231 | Tragic 11.9% |
| Sudanese | 5.3 /100 | #232 | Tragic 11.9% |
| Bermudans | 5.0 /100 | #233 | Tragic 11.9% |
| Portuguese | 4.9 /100 | #234 | Tragic 11.9% |
| Belizeans | 4.5 /100 | #235 | Tragic 12.0% |
| Immigrants | Middle Africa | 4.5 /100 | #236 | Tragic 12.0% |
| Immigrants | Cambodia | 3.9 /100 | #237 | Tragic 12.0% |
| West Indians | 3.7 /100 | #238 | Tragic 12.0% |
| Immigrants | Western Africa | 3.3 /100 | #239 | Tragic 12.0% |
| Immigrants | Thailand | 3.3 /100 | #240 | Tragic 12.0% |
| Mexican American Indians | 3.2 /100 | #241 | Tragic 12.0% |
| Samoans | 2.8 /100 | #242 | Tragic 12.1% |
| Slovaks | 2.7 /100 | #243 | Tragic 12.1% |
| Finns | 2.3 /100 | #244 | Tragic 12.1% |
| Immigrants | Mexico | 2.2 /100 | #245 | Tragic 12.1% |
Demographics Similar to Immigrants from Lebanon by Disability Age 35 to 64
In terms of disability age 35 to 64, the demographic groups most similar to Immigrants from Lebanon are Afghan (10.3%, a difference of 0.010%), Uruguayan (10.2%, a difference of 0.12%), Chilean (10.2%, a difference of 0.14%), Immigrants from Northern Africa (10.3%, a difference of 0.31%), and Immigrants from Europe (10.2%, a difference of 0.37%).
| Demographics | Rating | Rank | Disability Age 35 to 64 |
| Sri Lankans | 99.2 /100 | #84 | Exceptional 10.2% |
| Immigrants | Kuwait | 99.1 /100 | #85 | Exceptional 10.2% |
| Immigrants | Europe | 99.1 /100 | #86 | Exceptional 10.2% |
| Nicaraguans | 99.1 /100 | #87 | Exceptional 10.2% |
| Chileans | 99.0 /100 | #88 | Exceptional 10.2% |
| Uruguayans | 99.0 /100 | #89 | Exceptional 10.2% |
| Afghans | 98.9 /100 | #90 | Exceptional 10.3% |
| Immigrants | Lebanon | 98.9 /100 | #91 | Exceptional 10.3% |
| Immigrants | Northern Africa | 98.7 /100 | #92 | Exceptional 10.3% |
| Immigrants | North Macedonia | 98.7 /100 | #93 | Exceptional 10.3% |
| Immigrants | Italy | 98.7 /100 | #94 | Exceptional 10.3% |
| Chinese | 98.7 /100 | #95 | Exceptional 10.3% |
| Immigrants | South Africa | 98.5 /100 | #96 | Exceptional 10.3% |
| Immigrants | Denmark | 98.4 /100 | #97 | Exceptional 10.3% |
| Immigrants | Uruguay | 98.3 /100 | #98 | Exceptional 10.3% |