Filipino vs Immigrants from Belgium Hearing Disability
COMPARE
Filipino
Immigrants from Belgium
Hearing Disability
Hearing Disability Comparison
Filipinos
Immigrants from Belgium
2.6%
HEARING DISABILITY
99.6/ 100
METRIC RATING
33rd/ 347
METRIC RANK
3.0%
HEARING DISABILITY
41.5/ 100
METRIC RATING
181st/ 347
METRIC RANK
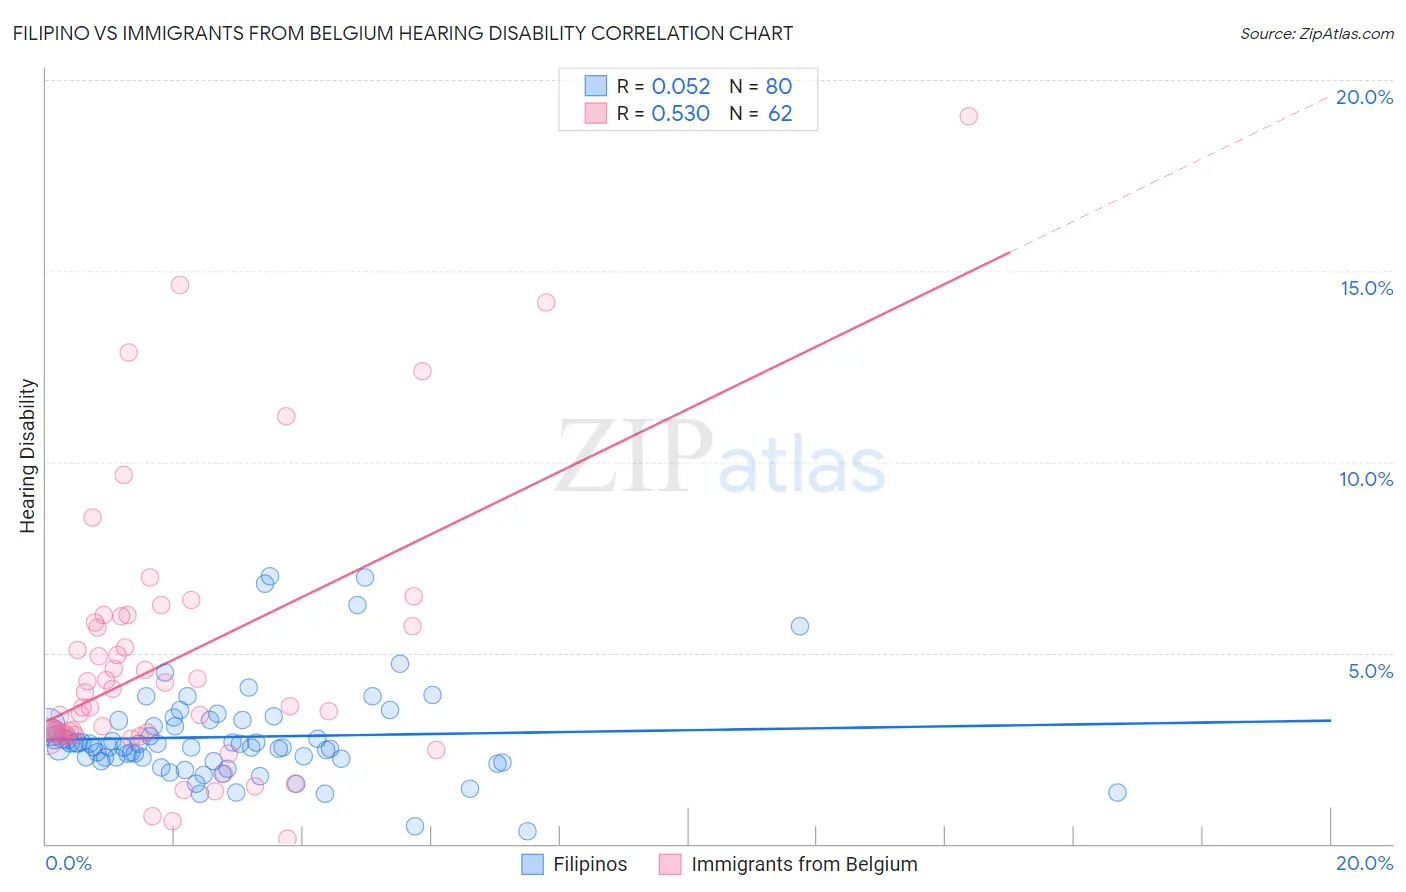
Filipino vs Immigrants from Belgium Hearing Disability Correlation Chart
The statistical analysis conducted on geographies consisting of 254,308,398 people shows a slight positive correlation between the proportion of Filipinos and percentage of population with hearing disability in the United States with a correlation coefficient (R) of 0.052 and weighted average of 2.6%. Similarly, the statistical analysis conducted on geographies consisting of 146,709,031 people shows a substantial positive correlation between the proportion of Immigrants from Belgium and percentage of population with hearing disability in the United States with a correlation coefficient (R) of 0.530 and weighted average of 3.0%, a difference of 15.9%.
Hearing Disability Correlation Summary
| Measurement | Filipino | Immigrants from Belgium |
| Minimum | 0.31% | 0.12% |
| Maximum | 7.0% | 19.0% |
| Range | 6.7% | 18.9% |
| Mean | 2.8% | 4.8% |
| Median | 2.6% | 3.6% |
| Interquartile 25% (IQ1) | 2.2% | 2.9% |
| Interquartile 75% (IQ3) | 3.2% | 5.8% |
| Interquartile Range (IQR) | 0.96% | 2.9% |
| Standard Deviation (Sample) | 1.3% | 3.6% |
| Standard Deviation (Population) | 1.2% | 3.6% |
Similar Demographics by Hearing Disability
Demographics Similar to Filipinos by Hearing Disability
In terms of hearing disability, the demographic groups most similar to Filipinos are Immigrants from Pakistan (2.6%, a difference of 0.040%), Salvadoran (2.6%, a difference of 0.16%), Immigrants from Venezuela (2.6%, a difference of 0.26%), Okinawan (2.6%, a difference of 0.39%), and Immigrants from Cameroon (2.6%, a difference of 0.40%).
| Demographics | Rating | Rank | Hearing Disability |
| Immigrants | Senegal | 99.7 /100 | #26 | Exceptional 2.6% |
| Immigrants | South Central Asia | 99.7 /100 | #27 | Exceptional 2.6% |
| Immigrants | Haiti | 99.7 /100 | #28 | Exceptional 2.6% |
| Bolivians | 99.7 /100 | #29 | Exceptional 2.6% |
| Immigrants | Caribbean | 99.7 /100 | #30 | Exceptional 2.6% |
| Immigrants | Cameroon | 99.7 /100 | #31 | Exceptional 2.6% |
| Immigrants | Venezuela | 99.7 /100 | #32 | Exceptional 2.6% |
| Filipinos | 99.6 /100 | #33 | Exceptional 2.6% |
| Immigrants | Pakistan | 99.6 /100 | #34 | Exceptional 2.6% |
| Salvadorans | 99.6 /100 | #35 | Exceptional 2.6% |
| Okinawans | 99.6 /100 | #36 | Exceptional 2.6% |
| Immigrants | Western Africa | 99.6 /100 | #37 | Exceptional 2.6% |
| Immigrants | Jamaica | 99.5 /100 | #38 | Exceptional 2.6% |
| Immigrants | China | 99.5 /100 | #39 | Exceptional 2.6% |
| Haitians | 99.5 /100 | #40 | Exceptional 2.6% |
Demographics Similar to Immigrants from Belgium by Hearing Disability
In terms of hearing disability, the demographic groups most similar to Immigrants from Belgium are Immigrants from Italy (3.0%, a difference of 0.030%), Immigrants from Sweden (3.0%, a difference of 0.090%), Immigrants from Moldova (3.0%, a difference of 0.15%), Bulgarian (3.0%, a difference of 0.17%), and Immigrants from Ireland (3.0%, a difference of 0.40%).
| Demographics | Rating | Rank | Hearing Disability |
| Indonesians | 50.0 /100 | #174 | Average 3.0% |
| Immigrants | Romania | 48.4 /100 | #175 | Average 3.0% |
| Panamanians | 47.0 /100 | #176 | Average 3.0% |
| Immigrants | Philippines | 46.4 /100 | #177 | Average 3.0% |
| Japanese | 46.0 /100 | #178 | Average 3.0% |
| Immigrants | Moldova | 43.1 /100 | #179 | Average 3.0% |
| Immigrants | Sweden | 42.4 /100 | #180 | Average 3.0% |
| Immigrants | Belgium | 41.5 /100 | #181 | Average 3.0% |
| Immigrants | Italy | 41.1 /100 | #182 | Average 3.0% |
| Bulgarians | 39.7 /100 | #183 | Fair 3.0% |
| Immigrants | Ireland | 37.4 /100 | #184 | Fair 3.0% |
| Immigrants | Southern Europe | 35.3 /100 | #185 | Fair 3.0% |
| Immigrants | Mexico | 34.9 /100 | #186 | Fair 3.0% |
| Blacks/African Americans | 34.7 /100 | #187 | Fair 3.0% |
| Mexican American Indians | 34.7 /100 | #188 | Fair 3.0% |