Venezuelan vs Iraqi Unemployment Among Ages 20 to 24 years
COMPARE
Venezuelan
Iraqi
Unemployment Among Ages 20 to 24 years
Unemployment Among Ages 20 to 24 years Comparison
Venezuelans
Iraqis
9.0%
UNEMPLOYMENT AMONG AGES 20 TO 24 YEARS
100.0/ 100
METRIC RATING
4th/ 347
METRIC RANK
10.3%
UNEMPLOYMENT AMONG AGES 20 TO 24 YEARS
56.7/ 100
METRIC RATING
168th/ 347
METRIC RANK
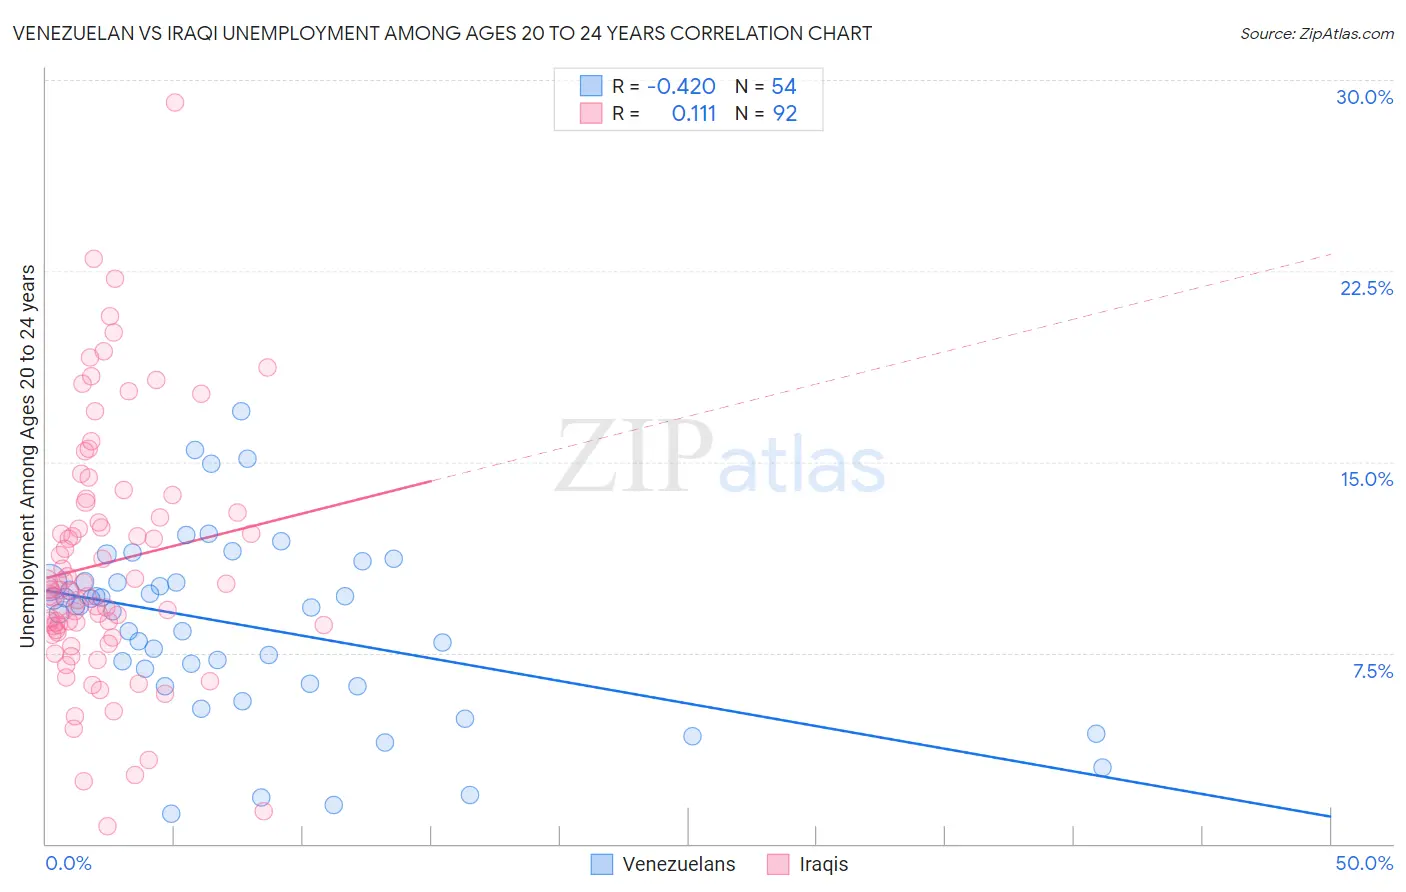
Venezuelan vs Iraqi Unemployment Among Ages 20 to 24 years Correlation Chart
The statistical analysis conducted on geographies consisting of 300,469,812 people shows a moderate negative correlation between the proportion of Venezuelans and unemployment rate among population between the ages 20 and 24 in the United States with a correlation coefficient (R) of -0.420 and weighted average of 9.0%. Similarly, the statistical analysis conducted on geographies consisting of 168,962,503 people shows a poor positive correlation between the proportion of Iraqis and unemployment rate among population between the ages 20 and 24 in the United States with a correlation coefficient (R) of 0.111 and weighted average of 10.3%, a difference of 14.1%.
Unemployment Among Ages 20 to 24 years Correlation Summary
| Measurement | Venezuelan | Iraqi |
| Minimum | 1.2% | 0.70% |
| Maximum | 17.0% | 29.1% |
| Range | 15.8% | 28.4% |
| Mean | 8.6% | 11.0% |
| Median | 9.3% | 10.0% |
| Interquartile 25% (IQ1) | 6.3% | 8.3% |
| Interquartile 75% (IQ3) | 10.3% | 13.2% |
| Interquartile Range (IQR) | 4.0% | 4.9% |
| Standard Deviation (Sample) | 3.5% | 4.9% |
| Standard Deviation (Population) | 3.5% | 4.9% |
Similar Demographics by Unemployment Among Ages 20 to 24 years
Demographics Similar to Venezuelans by Unemployment Among Ages 20 to 24 years
In terms of unemployment among ages 20 to 24 years, the demographic groups most similar to Venezuelans are Indonesian (9.0%, a difference of 0.21%), Norwegian (9.0%, a difference of 0.22%), Immigrants from Burma/Myanmar (9.1%, a difference of 0.82%), Luxembourger (9.1%, a difference of 1.2%), and Somali (9.1%, a difference of 1.2%).
| Demographics | Rating | Rank | Unemployment Among Ages 20 to 24 years |
| Immigrants | Cuba | 100.0 /100 | #1 | Exceptional 8.7% |
| Immigrants | Venezuela | 100.0 /100 | #2 | Exceptional 8.9% |
| Indonesians | 100.0 /100 | #3 | Exceptional 9.0% |
| Venezuelans | 100.0 /100 | #4 | Exceptional 9.0% |
| Norwegians | 100.0 /100 | #5 | Exceptional 9.0% |
| Immigrants | Burma/Myanmar | 100.0 /100 | #6 | Exceptional 9.1% |
| Luxembourgers | 100.0 /100 | #7 | Exceptional 9.1% |
| Somalis | 100.0 /100 | #8 | Exceptional 9.1% |
| Immigrants | Somalia | 100.0 /100 | #9 | Exceptional 9.2% |
| Sudanese | 100.0 /100 | #10 | Exceptional 9.2% |
| Zimbabweans | 100.0 /100 | #11 | Exceptional 9.2% |
| Cubans | 100.0 /100 | #12 | Exceptional 9.2% |
| Immigrants | Congo | 100.0 /100 | #13 | Exceptional 9.2% |
| Slovenes | 100.0 /100 | #14 | Exceptional 9.3% |
| Immigrants | Sudan | 100.0 /100 | #15 | Exceptional 9.3% |
Demographics Similar to Iraqis by Unemployment Among Ages 20 to 24 years
In terms of unemployment among ages 20 to 24 years, the demographic groups most similar to Iraqis are Immigrants from Colombia (10.3%, a difference of 0.020%), Immigrants from Fiji (10.3%, a difference of 0.030%), Italian (10.3%, a difference of 0.040%), Lebanese (10.3%, a difference of 0.060%), and Turkish (10.3%, a difference of 0.060%).
| Demographics | Rating | Rank | Unemployment Among Ages 20 to 24 years |
| Indians (Asian) | 62.6 /100 | #161 | Good 10.3% |
| Immigrants | Asia | 61.3 /100 | #162 | Good 10.3% |
| Estonians | 61.1 /100 | #163 | Good 10.3% |
| Immigrants | Korea | 59.0 /100 | #164 | Average 10.3% |
| Lebanese | 58.3 /100 | #165 | Average 10.3% |
| Italians | 57.7 /100 | #166 | Average 10.3% |
| Immigrants | Fiji | 57.6 /100 | #167 | Average 10.3% |
| Iraqis | 56.7 /100 | #168 | Average 10.3% |
| Immigrants | Colombia | 56.3 /100 | #169 | Average 10.3% |
| Turks | 55.2 /100 | #170 | Average 10.3% |
| Immigrants | Eastern Asia | 52.7 /100 | #171 | Average 10.3% |
| Koreans | 51.9 /100 | #172 | Average 10.3% |
| Immigrants | Sweden | 50.8 /100 | #173 | Average 10.3% |
| Ukrainians | 50.0 /100 | #174 | Average 10.3% |
| Samoans | 45.4 /100 | #175 | Average 10.3% |