Immigrants from Western Europe vs Sierra Leonean Cognitive Disability
COMPARE
Immigrants from Western Europe
Sierra Leonean
Cognitive Disability
Cognitive Disability Comparison
Immigrants from Western Europe
Sierra Leoneans
16.9%
COGNITIVE DISABILITY
94.8/ 100
METRIC RATING
122nd/ 347
METRIC RANK
17.9%
COGNITIVE DISABILITY
0.4/ 100
METRIC RATING
262nd/ 347
METRIC RANK
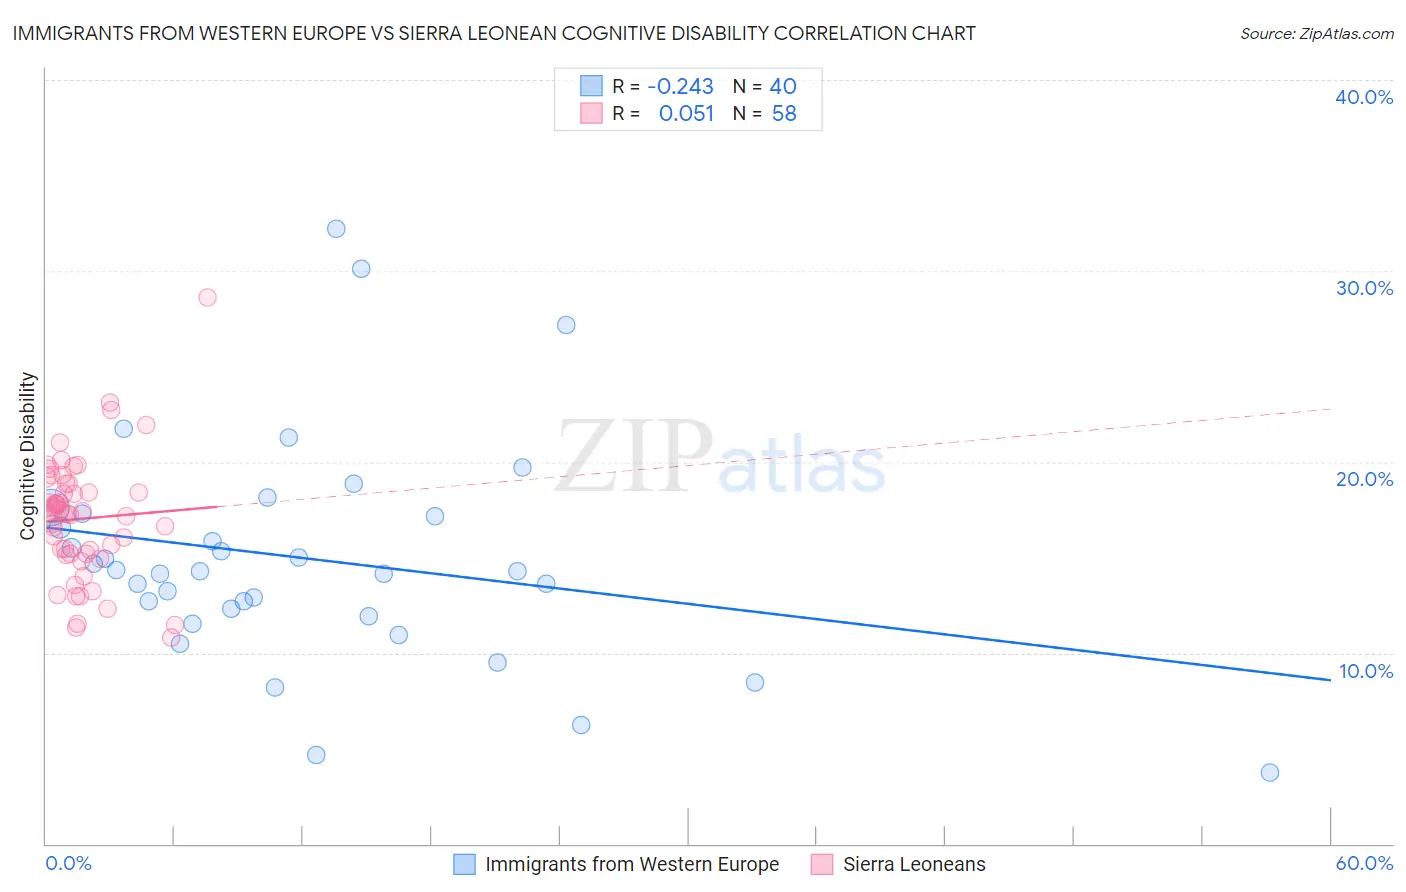
Immigrants from Western Europe vs Sierra Leonean Cognitive Disability Correlation Chart
The statistical analysis conducted on geographies consisting of 494,034,294 people shows a weak negative correlation between the proportion of Immigrants from Western Europe and percentage of population with cognitive disability in the United States with a correlation coefficient (R) of -0.243 and weighted average of 16.9%. Similarly, the statistical analysis conducted on geographies consisting of 83,361,112 people shows a slight positive correlation between the proportion of Sierra Leoneans and percentage of population with cognitive disability in the United States with a correlation coefficient (R) of 0.051 and weighted average of 17.9%, a difference of 6.0%.
Cognitive Disability Correlation Summary
| Measurement | Immigrants from Western Europe | Sierra Leonean |
| Minimum | 3.8% | 10.8% |
| Maximum | 32.2% | 28.6% |
| Range | 28.4% | 17.8% |
| Mean | 14.9% | 17.0% |
| Median | 14.3% | 17.3% |
| Interquartile 25% (IQ1) | 12.1% | 15.2% |
| Interquartile 75% (IQ3) | 17.2% | 18.8% |
| Interquartile Range (IQR) | 5.1% | 3.7% |
| Standard Deviation (Sample) | 5.9% | 3.2% |
| Standard Deviation (Population) | 5.8% | 3.2% |
Similar Demographics by Cognitive Disability
Demographics Similar to Immigrants from Western Europe by Cognitive Disability
In terms of cognitive disability, the demographic groups most similar to Immigrants from Western Europe are Portuguese (16.9%, a difference of 0.010%), Immigrants from China (16.9%, a difference of 0.020%), Scottish (16.9%, a difference of 0.030%), Turkish (16.9%, a difference of 0.030%), and Scandinavian (16.9%, a difference of 0.090%).
| Demographics | Rating | Rank | Cognitive Disability |
| Yup'ik | 96.9 /100 | #115 | Exceptional 16.9% |
| Inupiat | 96.5 /100 | #116 | Exceptional 16.9% |
| Immigrants | Japan | 96.2 /100 | #117 | Exceptional 16.9% |
| Immigrants | Denmark | 96.2 /100 | #118 | Exceptional 16.9% |
| South Africans | 95.5 /100 | #119 | Exceptional 16.9% |
| Scottish | 95.0 /100 | #120 | Exceptional 16.9% |
| Immigrants | China | 94.9 /100 | #121 | Exceptional 16.9% |
| Immigrants | Western Europe | 94.8 /100 | #122 | Exceptional 16.9% |
| Portuguese | 94.7 /100 | #123 | Exceptional 16.9% |
| Turks | 94.5 /100 | #124 | Exceptional 16.9% |
| Scandinavians | 94.1 /100 | #125 | Exceptional 16.9% |
| Europeans | 93.4 /100 | #126 | Exceptional 17.0% |
| Immigrants | Costa Rica | 93.1 /100 | #127 | Exceptional 17.0% |
| Nicaraguans | 93.0 /100 | #128 | Exceptional 17.0% |
| Immigrants | Uruguay | 92.9 /100 | #129 | Exceptional 17.0% |
Demographics Similar to Sierra Leoneans by Cognitive Disability
In terms of cognitive disability, the demographic groups most similar to Sierra Leoneans are Guamanian/Chamorro (17.9%, a difference of 0.030%), Immigrants from Barbados (17.9%, a difference of 0.040%), Immigrants from Belize (17.9%, a difference of 0.080%), Ethiopian (17.9%, a difference of 0.090%), and Menominee (18.0%, a difference of 0.10%).
| Demographics | Rating | Rank | Cognitive Disability |
| Immigrants | Azores | 0.6 /100 | #255 | Tragic 17.9% |
| Bahamians | 0.6 /100 | #256 | Tragic 17.9% |
| Mexican American Indians | 0.6 /100 | #257 | Tragic 17.9% |
| Immigrants | Armenia | 0.6 /100 | #258 | Tragic 17.9% |
| Ethiopians | 0.5 /100 | #259 | Tragic 17.9% |
| Immigrants | Belize | 0.5 /100 | #260 | Tragic 17.9% |
| Guamanians/Chamorros | 0.5 /100 | #261 | Tragic 17.9% |
| Sierra Leoneans | 0.4 /100 | #262 | Tragic 17.9% |
| Immigrants | Barbados | 0.4 /100 | #263 | Tragic 17.9% |
| Menominee | 0.4 /100 | #264 | Tragic 18.0% |
| Spanish Americans | 0.4 /100 | #265 | Tragic 18.0% |
| Belizeans | 0.4 /100 | #266 | Tragic 18.0% |
| Nepalese | 0.3 /100 | #267 | Tragic 18.0% |
| Cherokee | 0.3 /100 | #268 | Tragic 18.0% |
| Hondurans | 0.3 /100 | #269 | Tragic 18.0% |