U.S. Virgin Islander vs Chilean Female Disability
COMPARE
U.S. Virgin Islander
Chilean
Female Disability
Female Disability Comparison
U.S. Virgin Islanders
Chileans
13.1%
FEMALE DISABILITY
0.1/ 100
METRIC RATING
281st/ 347
METRIC RANK
11.5%
FEMALE DISABILITY
99.8/ 100
METRIC RATING
72nd/ 347
METRIC RANK
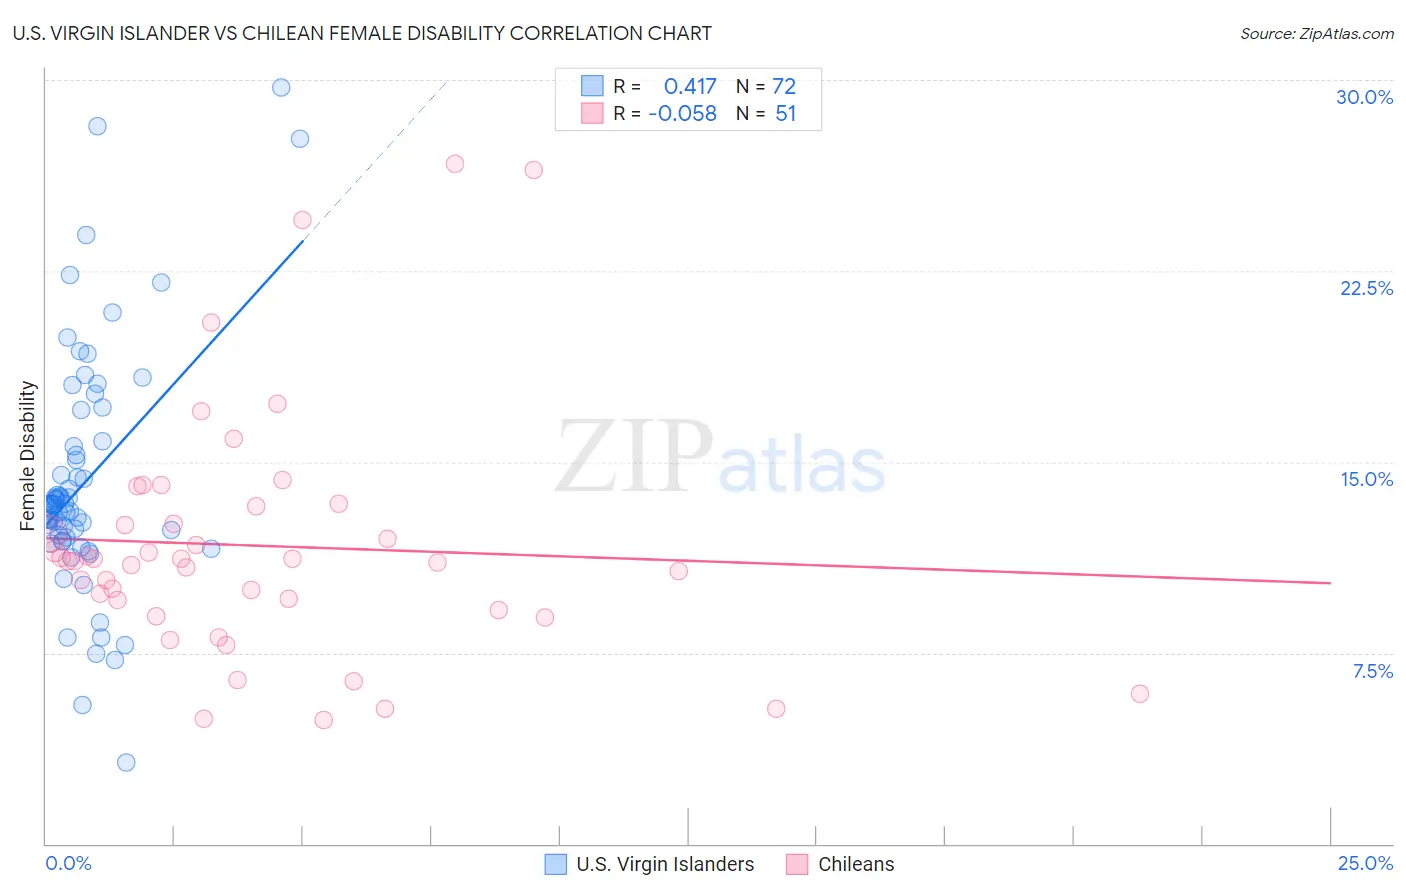
U.S. Virgin Islander vs Chilean Female Disability Correlation Chart
The statistical analysis conducted on geographies consisting of 87,518,599 people shows a moderate positive correlation between the proportion of U.S. Virgin Islanders and percentage of females with a disability in the United States with a correlation coefficient (R) of 0.417 and weighted average of 13.1%. Similarly, the statistical analysis conducted on geographies consisting of 256,651,441 people shows a slight negative correlation between the proportion of Chileans and percentage of females with a disability in the United States with a correlation coefficient (R) of -0.058 and weighted average of 11.5%, a difference of 13.7%.
Female Disability Correlation Summary
| Measurement | U.S. Virgin Islander | Chilean |
| Minimum | 3.2% | 4.8% |
| Maximum | 29.7% | 26.7% |
| Range | 26.5% | 21.8% |
| Mean | 14.2% | 11.7% |
| Median | 13.3% | 11.1% |
| Interquartile 25% (IQ1) | 12.0% | 9.2% |
| Interquartile 75% (IQ3) | 15.7% | 13.3% |
| Interquartile Range (IQR) | 3.8% | 4.1% |
| Standard Deviation (Sample) | 4.8% | 4.8% |
| Standard Deviation (Population) | 4.8% | 4.7% |
Similar Demographics by Female Disability
Demographics Similar to U.S. Virgin Islanders by Female Disability
In terms of female disability, the demographic groups most similar to U.S. Virgin Islanders are Irish (13.1%, a difference of 0.030%), Welsh (13.1%, a difference of 0.080%), English (13.1%, a difference of 0.080%), Arapaho (13.0%, a difference of 0.12%), and Hmong (13.1%, a difference of 0.22%).
| Demographics | Rating | Rank | Female Disability |
| Portuguese | 0.1 /100 | #274 | Tragic 13.0% |
| Cheyenne | 0.1 /100 | #275 | Tragic 13.0% |
| Immigrants | Dominica | 0.1 /100 | #276 | Tragic 13.0% |
| Spanish | 0.1 /100 | #277 | Tragic 13.0% |
| Scottish | 0.1 /100 | #278 | Tragic 13.0% |
| Arapaho | 0.1 /100 | #279 | Tragic 13.0% |
| Irish | 0.1 /100 | #280 | Tragic 13.1% |
| U.S. Virgin Islanders | 0.1 /100 | #281 | Tragic 13.1% |
| Welsh | 0.0 /100 | #282 | Tragic 13.1% |
| English | 0.0 /100 | #283 | Tragic 13.1% |
| Hmong | 0.0 /100 | #284 | Tragic 13.1% |
| Bangladeshis | 0.0 /100 | #285 | Tragic 13.1% |
| Fijians | 0.0 /100 | #286 | Tragic 13.1% |
| Yaqui | 0.0 /100 | #287 | Tragic 13.2% |
| Whites/Caucasians | 0.0 /100 | #288 | Tragic 13.2% |
Demographics Similar to Chileans by Female Disability
In terms of female disability, the demographic groups most similar to Chileans are Immigrants from Switzerland (11.5%, a difference of 0.020%), Immigrants from Ireland (11.5%, a difference of 0.070%), Bhutanese (11.5%, a difference of 0.090%), Immigrants from Chile (11.5%, a difference of 0.11%), and Colombian (11.5%, a difference of 0.12%).
| Demographics | Rating | Rank | Female Disability |
| Immigrants | South America | 99.9 /100 | #65 | Exceptional 11.4% |
| Salvadorans | 99.8 /100 | #66 | Exceptional 11.5% |
| Immigrants | Vietnam | 99.8 /100 | #67 | Exceptional 11.5% |
| Immigrants | Northern Africa | 99.8 /100 | #68 | Exceptional 11.5% |
| Colombians | 99.8 /100 | #69 | Exceptional 11.5% |
| Immigrants | Chile | 99.8 /100 | #70 | Exceptional 11.5% |
| Immigrants | Ireland | 99.8 /100 | #71 | Exceptional 11.5% |
| Chileans | 99.8 /100 | #72 | Exceptional 11.5% |
| Immigrants | Switzerland | 99.8 /100 | #73 | Exceptional 11.5% |
| Bhutanese | 99.8 /100 | #74 | Exceptional 11.5% |
| Immigrants | Lebanon | 99.7 /100 | #75 | Exceptional 11.5% |
| Immigrants | Eritrea | 99.7 /100 | #76 | Exceptional 11.5% |
| Immigrants | Afghanistan | 99.7 /100 | #77 | Exceptional 11.5% |
| Immigrants | South Africa | 99.7 /100 | #78 | Exceptional 11.5% |
| Sierra Leoneans | 99.7 /100 | #79 | Exceptional 11.5% |