Immigrants from Cabo Verde vs Chilean Female Disability
COMPARE
Immigrants from Cabo Verde
Chilean
Female Disability
Female Disability Comparison
Immigrants from Cabo Verde
Chileans
14.6%
FEMALE DISABILITY
0.0/ 100
METRIC RATING
331st/ 347
METRIC RANK
11.5%
FEMALE DISABILITY
99.8/ 100
METRIC RATING
72nd/ 347
METRIC RANK
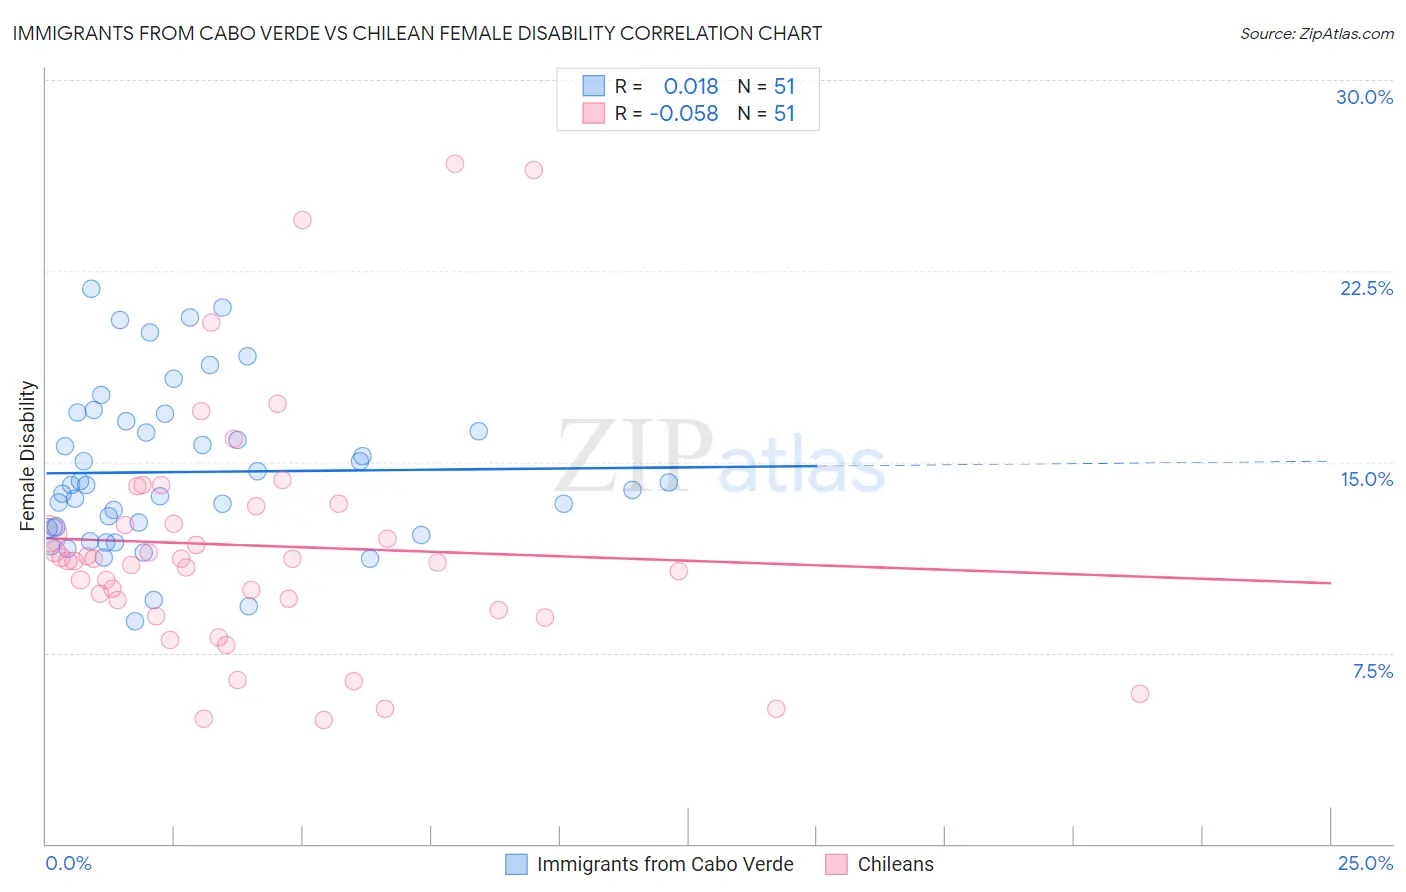
Immigrants from Cabo Verde vs Chilean Female Disability Correlation Chart
The statistical analysis conducted on geographies consisting of 38,139,523 people shows no correlation between the proportion of Immigrants from Cabo Verde and percentage of females with a disability in the United States with a correlation coefficient (R) of 0.018 and weighted average of 14.6%. Similarly, the statistical analysis conducted on geographies consisting of 256,651,441 people shows a slight negative correlation between the proportion of Chileans and percentage of females with a disability in the United States with a correlation coefficient (R) of -0.058 and weighted average of 11.5%, a difference of 26.7%.
Female Disability Correlation Summary
| Measurement | Immigrants from Cabo Verde | Chilean |
| Minimum | 8.7% | 4.8% |
| Maximum | 21.8% | 26.7% |
| Range | 13.1% | 21.8% |
| Mean | 14.6% | 11.7% |
| Median | 14.1% | 11.1% |
| Interquartile 25% (IQ1) | 12.4% | 9.2% |
| Interquartile 75% (IQ3) | 16.6% | 13.3% |
| Interquartile Range (IQR) | 4.2% | 4.1% |
| Standard Deviation (Sample) | 3.1% | 4.8% |
| Standard Deviation (Population) | 3.1% | 4.7% |
Similar Demographics by Female Disability
Demographics Similar to Immigrants from Cabo Verde by Female Disability
In terms of female disability, the demographic groups most similar to Immigrants from Cabo Verde are Yuman (14.5%, a difference of 0.42%), Pima (14.8%, a difference of 1.6%), Osage (14.3%, a difference of 1.8%), Immigrants from the Azores (14.9%, a difference of 2.0%), and Cherokee (14.9%, a difference of 2.1%).
| Demographics | Rating | Rank | Female Disability |
| Natives/Alaskans | 0.0 /100 | #324 | Tragic 14.1% |
| Navajo | 0.0 /100 | #325 | Tragic 14.2% |
| Comanche | 0.0 /100 | #326 | Tragic 14.2% |
| Ottawa | 0.0 /100 | #327 | Tragic 14.2% |
| Cape Verdeans | 0.0 /100 | #328 | Tragic 14.2% |
| Osage | 0.0 /100 | #329 | Tragic 14.3% |
| Yuman | 0.0 /100 | #330 | Tragic 14.5% |
| Immigrants | Cabo Verde | 0.0 /100 | #331 | Tragic 14.6% |
| Pima | 0.0 /100 | #332 | Tragic 14.8% |
| Immigrants | Azores | 0.0 /100 | #333 | Tragic 14.9% |
| Cherokee | 0.0 /100 | #334 | Tragic 14.9% |
| Cajuns | 0.0 /100 | #335 | Tragic 14.9% |
| Seminole | 0.0 /100 | #336 | Tragic 15.0% |
| Tohono O'odham | 0.0 /100 | #337 | Tragic 15.0% |
| Dutch West Indians | 0.0 /100 | #338 | Tragic 15.0% |
Demographics Similar to Chileans by Female Disability
In terms of female disability, the demographic groups most similar to Chileans are Immigrants from Switzerland (11.5%, a difference of 0.020%), Immigrants from Ireland (11.5%, a difference of 0.070%), Bhutanese (11.5%, a difference of 0.090%), Immigrants from Chile (11.5%, a difference of 0.11%), and Colombian (11.5%, a difference of 0.12%).
| Demographics | Rating | Rank | Female Disability |
| Immigrants | South America | 99.9 /100 | #65 | Exceptional 11.4% |
| Salvadorans | 99.8 /100 | #66 | Exceptional 11.5% |
| Immigrants | Vietnam | 99.8 /100 | #67 | Exceptional 11.5% |
| Immigrants | Northern Africa | 99.8 /100 | #68 | Exceptional 11.5% |
| Colombians | 99.8 /100 | #69 | Exceptional 11.5% |
| Immigrants | Chile | 99.8 /100 | #70 | Exceptional 11.5% |
| Immigrants | Ireland | 99.8 /100 | #71 | Exceptional 11.5% |
| Chileans | 99.8 /100 | #72 | Exceptional 11.5% |
| Immigrants | Switzerland | 99.8 /100 | #73 | Exceptional 11.5% |
| Bhutanese | 99.8 /100 | #74 | Exceptional 11.5% |
| Immigrants | Lebanon | 99.7 /100 | #75 | Exceptional 11.5% |
| Immigrants | Eritrea | 99.7 /100 | #76 | Exceptional 11.5% |
| Immigrants | Afghanistan | 99.7 /100 | #77 | Exceptional 11.5% |
| Immigrants | South Africa | 99.7 /100 | #78 | Exceptional 11.5% |
| Sierra Leoneans | 99.7 /100 | #79 | Exceptional 11.5% |