Uruguayan vs Russian Disability Age 35 to 64
COMPARE
Uruguayan
Russian
Disability Age 35 to 64
Disability Age 35 to 64 Comparison
Uruguayans
Russians
10.2%
DISABILITY AGE 35 TO 64
99.0/ 100
METRIC RATING
89th/ 347
METRIC RANK
10.2%
DISABILITY AGE 35 TO 64
99.2/ 100
METRIC RATING
82nd/ 347
METRIC RANK
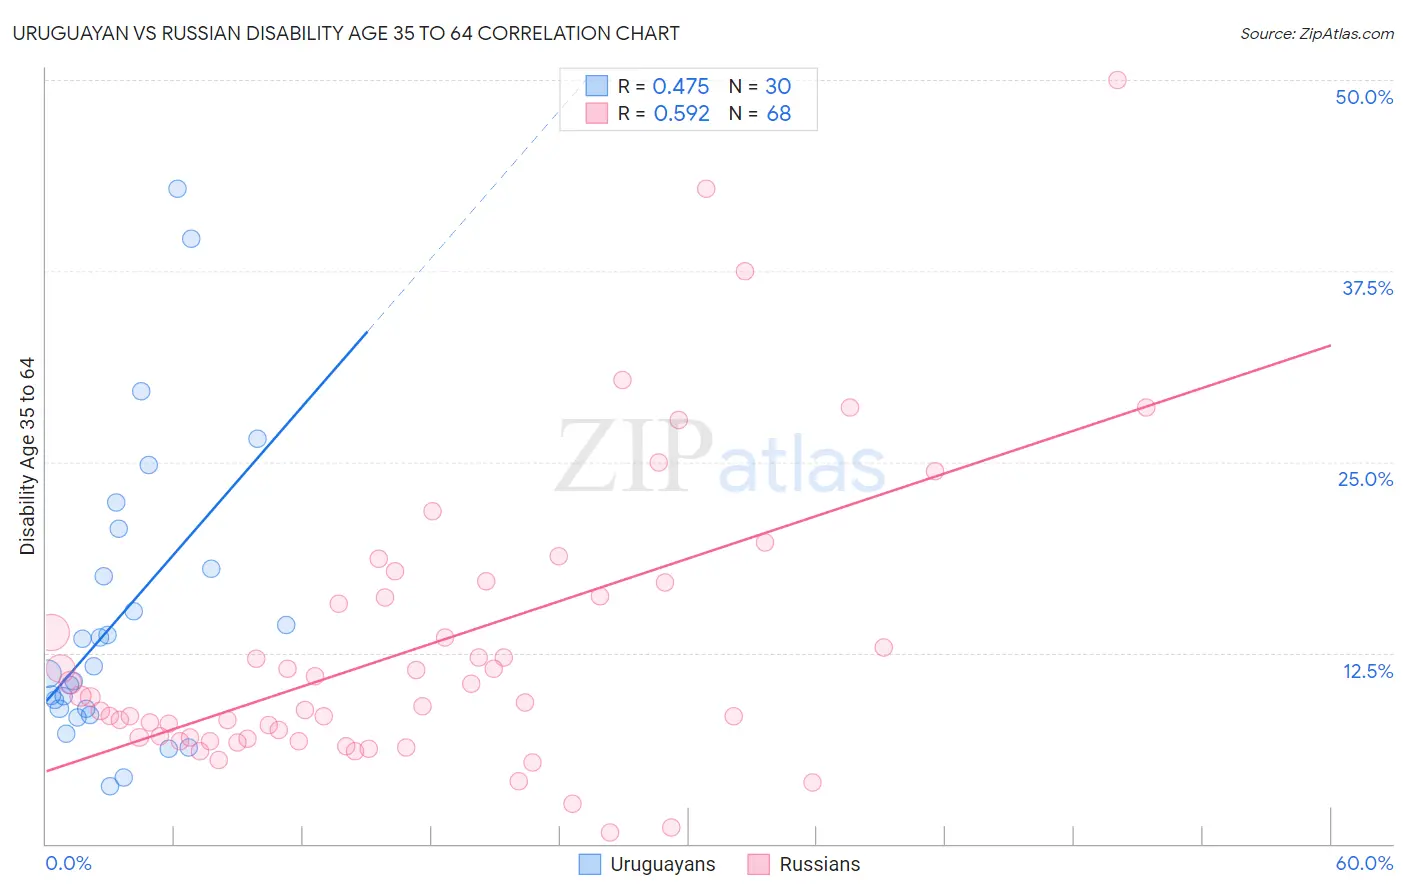
Uruguayan vs Russian Disability Age 35 to 64 Correlation Chart
The statistical analysis conducted on geographies consisting of 144,764,397 people shows a moderate positive correlation between the proportion of Uruguayans and percentage of population with a disability between the ages 34 and 64 in the United States with a correlation coefficient (R) of 0.475 and weighted average of 10.2%. Similarly, the statistical analysis conducted on geographies consisting of 511,532,980 people shows a substantial positive correlation between the proportion of Russians and percentage of population with a disability between the ages 34 and 64 in the United States with a correlation coefficient (R) of 0.592 and weighted average of 10.2%, a difference of 0.61%.
Disability Age 35 to 64 Correlation Summary
| Measurement | Uruguayan | Russian |
| Minimum | 3.7% | 0.73% |
| Maximum | 42.9% | 50.0% |
| Range | 39.1% | 49.3% |
| Mean | 14.9% | 12.8% |
| Median | 11.4% | 9.4% |
| Interquartile 25% (IQ1) | 8.8% | 6.9% |
| Interquartile 75% (IQ3) | 18.0% | 16.2% |
| Interquartile Range (IQR) | 9.2% | 9.3% |
| Standard Deviation (Sample) | 9.7% | 9.5% |
| Standard Deviation (Population) | 9.5% | 9.4% |
Demographics Similar to Uruguayans and Russians by Disability Age 35 to 64
In terms of disability age 35 to 64, the demographic groups most similar to Uruguayans are Chilean (10.2%, a difference of 0.010%), Afghan (10.3%, a difference of 0.11%), Immigrants from Lebanon (10.3%, a difference of 0.12%), Immigrants from Europe (10.2%, a difference of 0.25%), and Nicaraguan (10.2%, a difference of 0.25%). Similarly, the demographic groups most similar to Russians are Immigrants from Brazil (10.2%, a difference of 0.020%), Latvian (10.2%, a difference of 0.060%), Sri Lankan (10.2%, a difference of 0.080%), Immigrants from Croatia (10.2%, a difference of 0.16%), and Immigrants from Vietnam (10.1%, a difference of 0.28%).
| Demographics | Rating | Rank | Disability Age 35 to 64 |
| Immigrants | Latvia | 99.4 /100 | #75 | Exceptional 10.1% |
| Immigrants | Chile | 99.4 /100 | #76 | Exceptional 10.1% |
| Mongolians | 99.4 /100 | #77 | Exceptional 10.1% |
| Jordanians | 99.3 /100 | #78 | Exceptional 10.1% |
| Immigrants | Vietnam | 99.3 /100 | #79 | Exceptional 10.1% |
| Immigrants | Croatia | 99.3 /100 | #80 | Exceptional 10.2% |
| Latvians | 99.2 /100 | #81 | Exceptional 10.2% |
| Russians | 99.2 /100 | #82 | Exceptional 10.2% |
| Immigrants | Brazil | 99.2 /100 | #83 | Exceptional 10.2% |
| Sri Lankans | 99.2 /100 | #84 | Exceptional 10.2% |
| Immigrants | Kuwait | 99.1 /100 | #85 | Exceptional 10.2% |
| Immigrants | Europe | 99.1 /100 | #86 | Exceptional 10.2% |
| Nicaraguans | 99.1 /100 | #87 | Exceptional 10.2% |
| Chileans | 99.0 /100 | #88 | Exceptional 10.2% |
| Uruguayans | 99.0 /100 | #89 | Exceptional 10.2% |
| Afghans | 98.9 /100 | #90 | Exceptional 10.3% |
| Immigrants | Lebanon | 98.9 /100 | #91 | Exceptional 10.3% |
| Immigrants | Northern Africa | 98.7 /100 | #92 | Exceptional 10.3% |
| Immigrants | North Macedonia | 98.7 /100 | #93 | Exceptional 10.3% |
| Immigrants | Italy | 98.7 /100 | #94 | Exceptional 10.3% |
| Chinese | 98.7 /100 | #95 | Exceptional 10.3% |