Immigrants from Romania vs Russian Disability Age 35 to 64
COMPARE
Immigrants from Romania
Russian
Disability Age 35 to 64
Disability Age 35 to 64 Comparison
Immigrants from Romania
Russians
10.0%
DISABILITY AGE 35 TO 64
99.7/ 100
METRIC RATING
64th/ 347
METRIC RANK
10.2%
DISABILITY AGE 35 TO 64
99.2/ 100
METRIC RATING
82nd/ 347
METRIC RANK
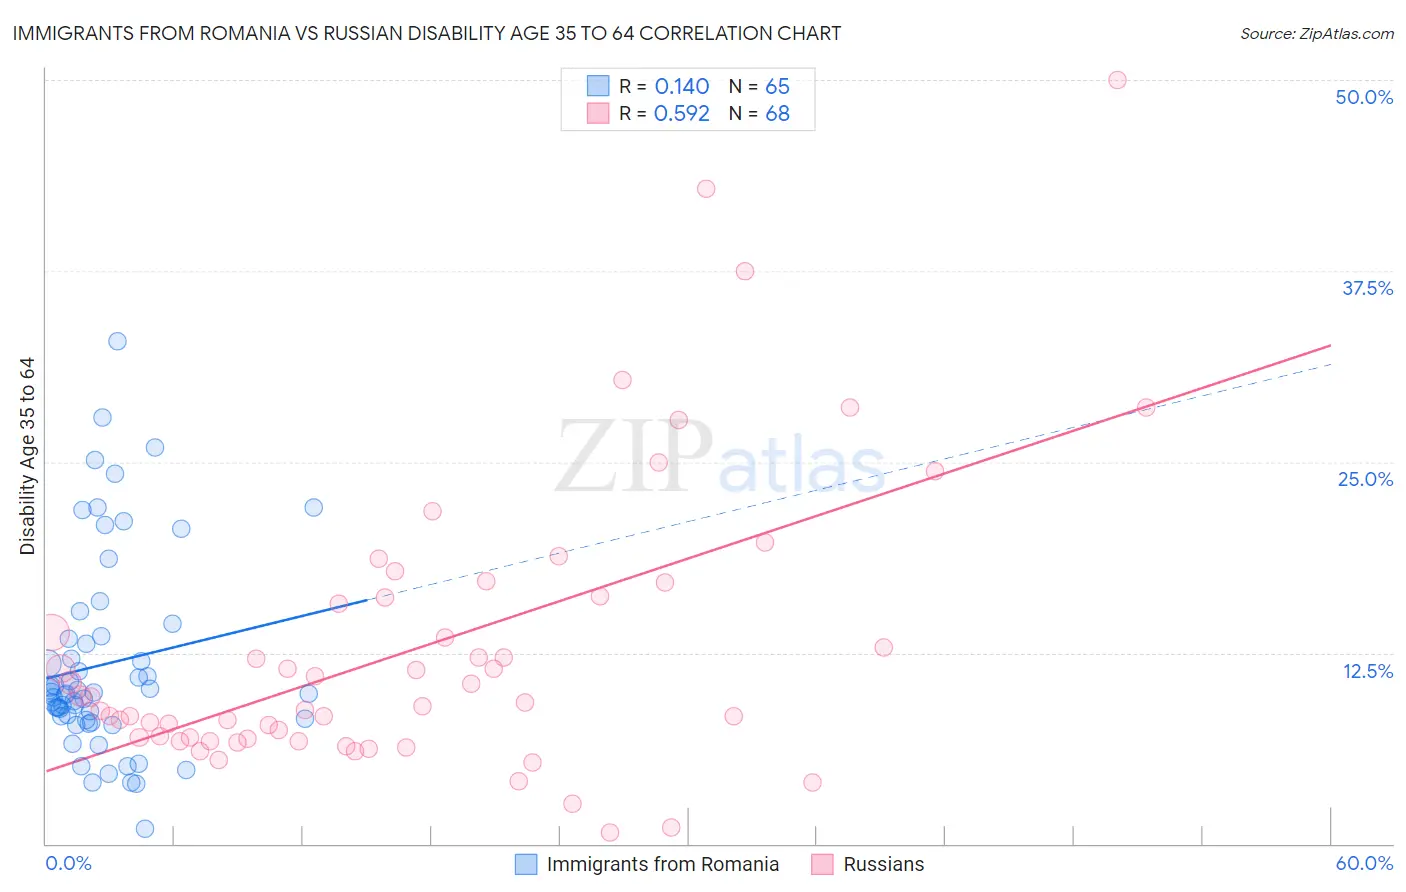
Immigrants from Romania vs Russian Disability Age 35 to 64 Correlation Chart
The statistical analysis conducted on geographies consisting of 256,941,595 people shows a poor positive correlation between the proportion of Immigrants from Romania and percentage of population with a disability between the ages 34 and 64 in the United States with a correlation coefficient (R) of 0.140 and weighted average of 10.0%. Similarly, the statistical analysis conducted on geographies consisting of 511,532,980 people shows a substantial positive correlation between the proportion of Russians and percentage of population with a disability between the ages 34 and 64 in the United States with a correlation coefficient (R) of 0.592 and weighted average of 10.2%, a difference of 1.8%.
Disability Age 35 to 64 Correlation Summary
| Measurement | Immigrants from Romania | Russian |
| Minimum | 1.0% | 0.73% |
| Maximum | 32.9% | 50.0% |
| Range | 31.8% | 49.3% |
| Mean | 11.8% | 12.8% |
| Median | 9.8% | 9.4% |
| Interquartile 25% (IQ1) | 8.1% | 6.9% |
| Interquartile 75% (IQ3) | 13.5% | 16.2% |
| Interquartile Range (IQR) | 5.3% | 9.3% |
| Standard Deviation (Sample) | 6.5% | 9.5% |
| Standard Deviation (Population) | 6.4% | 9.4% |
Demographics Similar to Immigrants from Romania and Russians by Disability Age 35 to 64
In terms of disability age 35 to 64, the demographic groups most similar to Immigrants from Romania are Immigrants from Poland (10.0%, a difference of 0.070%), Immigrants from Czechoslovakia (10.0%, a difference of 0.20%), Cuban (10.0%, a difference of 0.32%), Immigrants from Uzbekistan (10.1%, a difference of 0.67%), and Immigrants from Switzerland (10.1%, a difference of 0.78%). Similarly, the demographic groups most similar to Russians are Immigrants from Brazil (10.2%, a difference of 0.020%), Latvian (10.2%, a difference of 0.060%), Immigrants from Croatia (10.2%, a difference of 0.16%), Immigrants from Vietnam (10.1%, a difference of 0.28%), and Jordanian (10.1%, a difference of 0.35%).
| Demographics | Rating | Rank | Disability Age 35 to 64 |
| Immigrants | Czechoslovakia | 99.7 /100 | #63 | Exceptional 10.0% |
| Immigrants | Romania | 99.7 /100 | #64 | Exceptional 10.0% |
| Immigrants | Poland | 99.6 /100 | #65 | Exceptional 10.0% |
| Cubans | 99.6 /100 | #66 | Exceptional 10.0% |
| Immigrants | Uzbekistan | 99.5 /100 | #67 | Exceptional 10.1% |
| Immigrants | Switzerland | 99.5 /100 | #68 | Exceptional 10.1% |
| Immigrants | Eastern Europe | 99.5 /100 | #69 | Exceptional 10.1% |
| Immigrants | Nicaragua | 99.5 /100 | #70 | Exceptional 10.1% |
| Immigrants | Kazakhstan | 99.5 /100 | #71 | Exceptional 10.1% |
| Immigrants | Northern Europe | 99.5 /100 | #72 | Exceptional 10.1% |
| Immigrants | France | 99.5 /100 | #73 | Exceptional 10.1% |
| Laotians | 99.4 /100 | #74 | Exceptional 10.1% |
| Immigrants | Latvia | 99.4 /100 | #75 | Exceptional 10.1% |
| Immigrants | Chile | 99.4 /100 | #76 | Exceptional 10.1% |
| Mongolians | 99.4 /100 | #77 | Exceptional 10.1% |
| Jordanians | 99.3 /100 | #78 | Exceptional 10.1% |
| Immigrants | Vietnam | 99.3 /100 | #79 | Exceptional 10.1% |
| Immigrants | Croatia | 99.3 /100 | #80 | Exceptional 10.2% |
| Latvians | 99.2 /100 | #81 | Exceptional 10.2% |
| Russians | 99.2 /100 | #82 | Exceptional 10.2% |
| Immigrants | Brazil | 99.2 /100 | #83 | Exceptional 10.2% |