Uruguayan vs Immigrants from Nicaragua Disability Age 35 to 64
COMPARE
Uruguayan
Immigrants from Nicaragua
Disability Age 35 to 64
Disability Age 35 to 64 Comparison
Uruguayans
Immigrants from Nicaragua
10.2%
DISABILITY AGE 35 TO 64
99.0/ 100
METRIC RATING
89th/ 347
METRIC RANK
10.1%
DISABILITY AGE 35 TO 64
99.5/ 100
METRIC RATING
70th/ 347
METRIC RANK
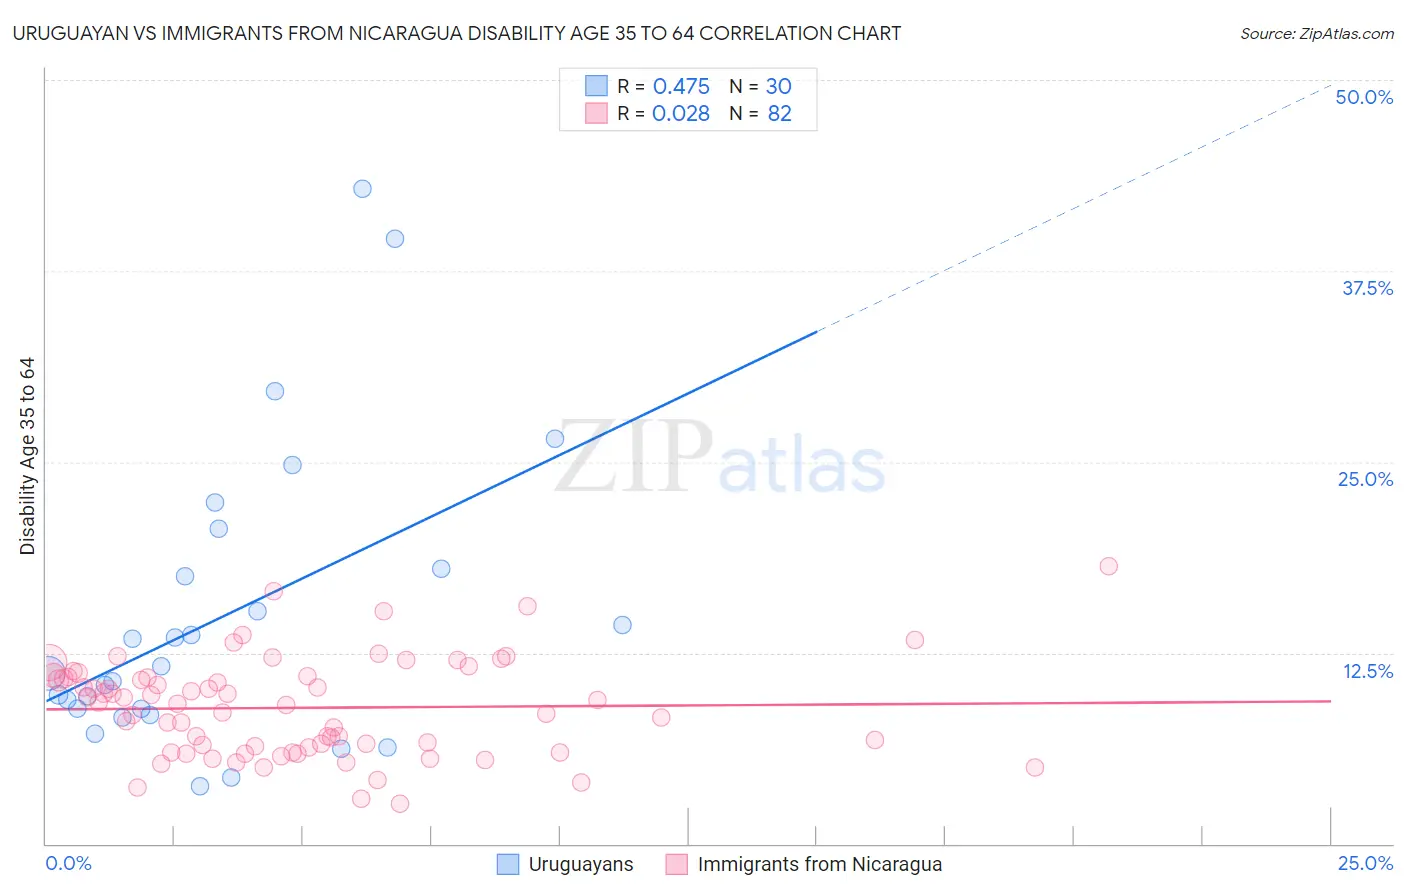
Uruguayan vs Immigrants from Nicaragua Disability Age 35 to 64 Correlation Chart
The statistical analysis conducted on geographies consisting of 144,764,397 people shows a moderate positive correlation between the proportion of Uruguayans and percentage of population with a disability between the ages 34 and 64 in the United States with a correlation coefficient (R) of 0.475 and weighted average of 10.2%. Similarly, the statistical analysis conducted on geographies consisting of 236,317,781 people shows no correlation between the proportion of Immigrants from Nicaragua and percentage of population with a disability between the ages 34 and 64 in the United States with a correlation coefficient (R) of 0.028 and weighted average of 10.1%, a difference of 1.7%.
Disability Age 35 to 64 Correlation Summary
| Measurement | Uruguayan | Immigrants from Nicaragua |
| Minimum | 3.7% | 2.6% |
| Maximum | 42.9% | 18.2% |
| Range | 39.1% | 15.6% |
| Mean | 14.9% | 8.9% |
| Median | 11.4% | 9.2% |
| Interquartile 25% (IQ1) | 8.8% | 6.3% |
| Interquartile 75% (IQ3) | 18.0% | 10.9% |
| Interquartile Range (IQR) | 9.2% | 4.6% |
| Standard Deviation (Sample) | 9.7% | 3.2% |
| Standard Deviation (Population) | 9.5% | 3.2% |
Demographics Similar to Uruguayans and Immigrants from Nicaragua by Disability Age 35 to 64
In terms of disability age 35 to 64, the demographic groups most similar to Uruguayans are Chilean (10.2%, a difference of 0.010%), Immigrants from Europe (10.2%, a difference of 0.25%), Nicaraguan (10.2%, a difference of 0.25%), Immigrants from Kuwait (10.2%, a difference of 0.32%), and Sri Lankan (10.2%, a difference of 0.54%). Similarly, the demographic groups most similar to Immigrants from Nicaragua are Immigrants from Kazakhstan (10.1%, a difference of 0.010%), Immigrants from Eastern Europe (10.1%, a difference of 0.020%), Immigrants from Northern Europe (10.1%, a difference of 0.21%), Immigrants from France (10.1%, a difference of 0.21%), and Laotian (10.1%, a difference of 0.40%).
| Demographics | Rating | Rank | Disability Age 35 to 64 |
| Immigrants | Eastern Europe | 99.5 /100 | #69 | Exceptional 10.1% |
| Immigrants | Nicaragua | 99.5 /100 | #70 | Exceptional 10.1% |
| Immigrants | Kazakhstan | 99.5 /100 | #71 | Exceptional 10.1% |
| Immigrants | Northern Europe | 99.5 /100 | #72 | Exceptional 10.1% |
| Immigrants | France | 99.5 /100 | #73 | Exceptional 10.1% |
| Laotians | 99.4 /100 | #74 | Exceptional 10.1% |
| Immigrants | Latvia | 99.4 /100 | #75 | Exceptional 10.1% |
| Immigrants | Chile | 99.4 /100 | #76 | Exceptional 10.1% |
| Mongolians | 99.4 /100 | #77 | Exceptional 10.1% |
| Jordanians | 99.3 /100 | #78 | Exceptional 10.1% |
| Immigrants | Vietnam | 99.3 /100 | #79 | Exceptional 10.1% |
| Immigrants | Croatia | 99.3 /100 | #80 | Exceptional 10.2% |
| Latvians | 99.2 /100 | #81 | Exceptional 10.2% |
| Russians | 99.2 /100 | #82 | Exceptional 10.2% |
| Immigrants | Brazil | 99.2 /100 | #83 | Exceptional 10.2% |
| Sri Lankans | 99.2 /100 | #84 | Exceptional 10.2% |
| Immigrants | Kuwait | 99.1 /100 | #85 | Exceptional 10.2% |
| Immigrants | Europe | 99.1 /100 | #86 | Exceptional 10.2% |
| Nicaraguans | 99.1 /100 | #87 | Exceptional 10.2% |
| Chileans | 99.0 /100 | #88 | Exceptional 10.2% |
| Uruguayans | 99.0 /100 | #89 | Exceptional 10.2% |