South American vs Liberian Disability Age Over 75
COMPARE
South American
Liberian
Disability Age Over 75
Disability Age Over 75 Comparison
South Americans
Liberians
46.8%
DISABILITY AGE OVER 75
90.0/ 100
METRIC RATING
132nd/ 347
METRIC RANK
48.0%
DISABILITY AGE OVER 75
6.7/ 100
METRIC RATING
224th/ 347
METRIC RANK
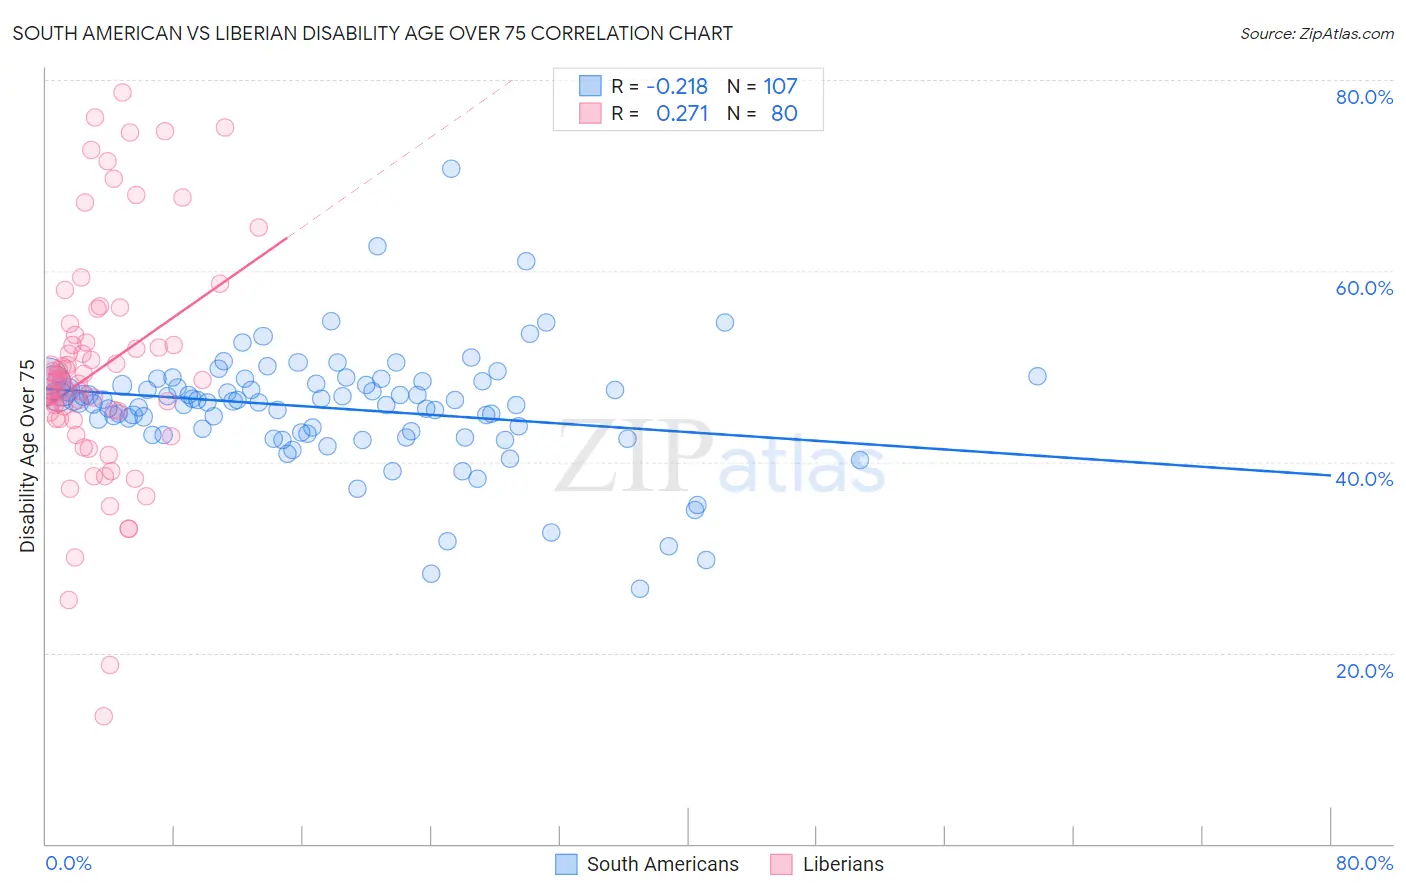
South American vs Liberian Disability Age Over 75 Correlation Chart
The statistical analysis conducted on geographies consisting of 492,705,968 people shows a weak negative correlation between the proportion of South Americans and percentage of population with a disability over the age of 75 in the United States with a correlation coefficient (R) of -0.218 and weighted average of 46.8%. Similarly, the statistical analysis conducted on geographies consisting of 117,925,448 people shows a weak positive correlation between the proportion of Liberians and percentage of population with a disability over the age of 75 in the United States with a correlation coefficient (R) of 0.271 and weighted average of 48.0%, a difference of 2.7%.
Disability Age Over 75 Correlation Summary
| Measurement | South American | Liberian |
| Minimum | 26.7% | 13.3% |
| Maximum | 70.7% | 78.6% |
| Range | 44.1% | 65.3% |
| Mean | 45.6% | 49.6% |
| Median | 46.4% | 48.5% |
| Interquartile 25% (IQ1) | 43.0% | 44.5% |
| Interquartile 75% (IQ3) | 48.3% | 52.9% |
| Interquartile Range (IQR) | 5.3% | 8.3% |
| Standard Deviation (Sample) | 6.2% | 12.3% |
| Standard Deviation (Population) | 6.2% | 12.2% |
Similar Demographics by Disability Age Over 75
Demographics Similar to South Americans by Disability Age Over 75
In terms of disability age over 75, the demographic groups most similar to South Americans are Scottish (46.7%, a difference of 0.030%), English (46.8%, a difference of 0.040%), Immigrants from Northern Africa (46.7%, a difference of 0.050%), Immigrants from Ethiopia (46.8%, a difference of 0.050%), and Icelander (46.7%, a difference of 0.060%).
| Demographics | Rating | Rank | Disability Age Over 75 |
| Colombians | 91.3 /100 | #125 | Exceptional 46.7% |
| Europeans | 91.2 /100 | #126 | Exceptional 46.7% |
| Syrians | 91.1 /100 | #127 | Exceptional 46.7% |
| Icelanders | 90.9 /100 | #128 | Exceptional 46.7% |
| Immigrants | Germany | 90.8 /100 | #129 | Exceptional 46.7% |
| Immigrants | Northern Africa | 90.7 /100 | #130 | Exceptional 46.7% |
| Scottish | 90.5 /100 | #131 | Exceptional 46.7% |
| South Americans | 90.0 /100 | #132 | Excellent 46.8% |
| English | 89.4 /100 | #133 | Excellent 46.8% |
| Immigrants | Ethiopia | 89.1 /100 | #134 | Excellent 46.8% |
| Ethiopians | 88.9 /100 | #135 | Excellent 46.8% |
| Immigrants | Venezuela | 88.6 /100 | #136 | Excellent 46.8% |
| Immigrants | Uganda | 88.5 /100 | #137 | Excellent 46.8% |
| Immigrants | Bosnia and Herzegovina | 88.5 /100 | #138 | Excellent 46.8% |
| Yugoslavians | 88.5 /100 | #139 | Excellent 46.8% |
Demographics Similar to Liberians by Disability Age Over 75
In terms of disability age over 75, the demographic groups most similar to Liberians are Barbadian (48.0%, a difference of 0.010%), Immigrants from Bangladesh (48.0%, a difference of 0.010%), Spanish (48.0%, a difference of 0.010%), Nonimmigrants (48.0%, a difference of 0.020%), and Zimbabwean (48.1%, a difference of 0.020%).
| Demographics | Rating | Rank | Disability Age Over 75 |
| Immigrants | Grenada | 9.4 /100 | #217 | Tragic 47.9% |
| Immigrants | Western Africa | 8.3 /100 | #218 | Tragic 48.0% |
| Immigrants | Western Asia | 7.5 /100 | #219 | Tragic 48.0% |
| Bahamians | 7.4 /100 | #220 | Tragic 48.0% |
| Immigrants | Oceania | 7.3 /100 | #221 | Tragic 48.0% |
| Barbadians | 6.8 /100 | #222 | Tragic 48.0% |
| Immigrants | Bangladesh | 6.8 /100 | #223 | Tragic 48.0% |
| Liberians | 6.7 /100 | #224 | Tragic 48.0% |
| Spanish | 6.5 /100 | #225 | Tragic 48.0% |
| Immigrants | Nonimmigrants | 6.5 /100 | #226 | Tragic 48.0% |
| Zimbabweans | 6.4 /100 | #227 | Tragic 48.1% |
| Immigrants | Liberia | 5.9 /100 | #228 | Tragic 48.1% |
| Spaniards | 5.7 /100 | #229 | Tragic 48.1% |
| Taiwanese | 4.4 /100 | #230 | Tragic 48.2% |
| Immigrants | Immigrants | 4.3 /100 | #231 | Tragic 48.2% |