Tsimshian vs Haitian Ambulatory Disability
COMPARE
Tsimshian
Haitian
Ambulatory Disability
Ambulatory Disability Comparison
Tsimshian
Haitians
8.8%
AMBULATORY DISABILITY
0.0/ 100
METRIC RATING
344th/ 347
METRIC RANK
6.4%
AMBULATORY DISABILITY
1.8/ 100
METRIC RATING
238th/ 347
METRIC RANK
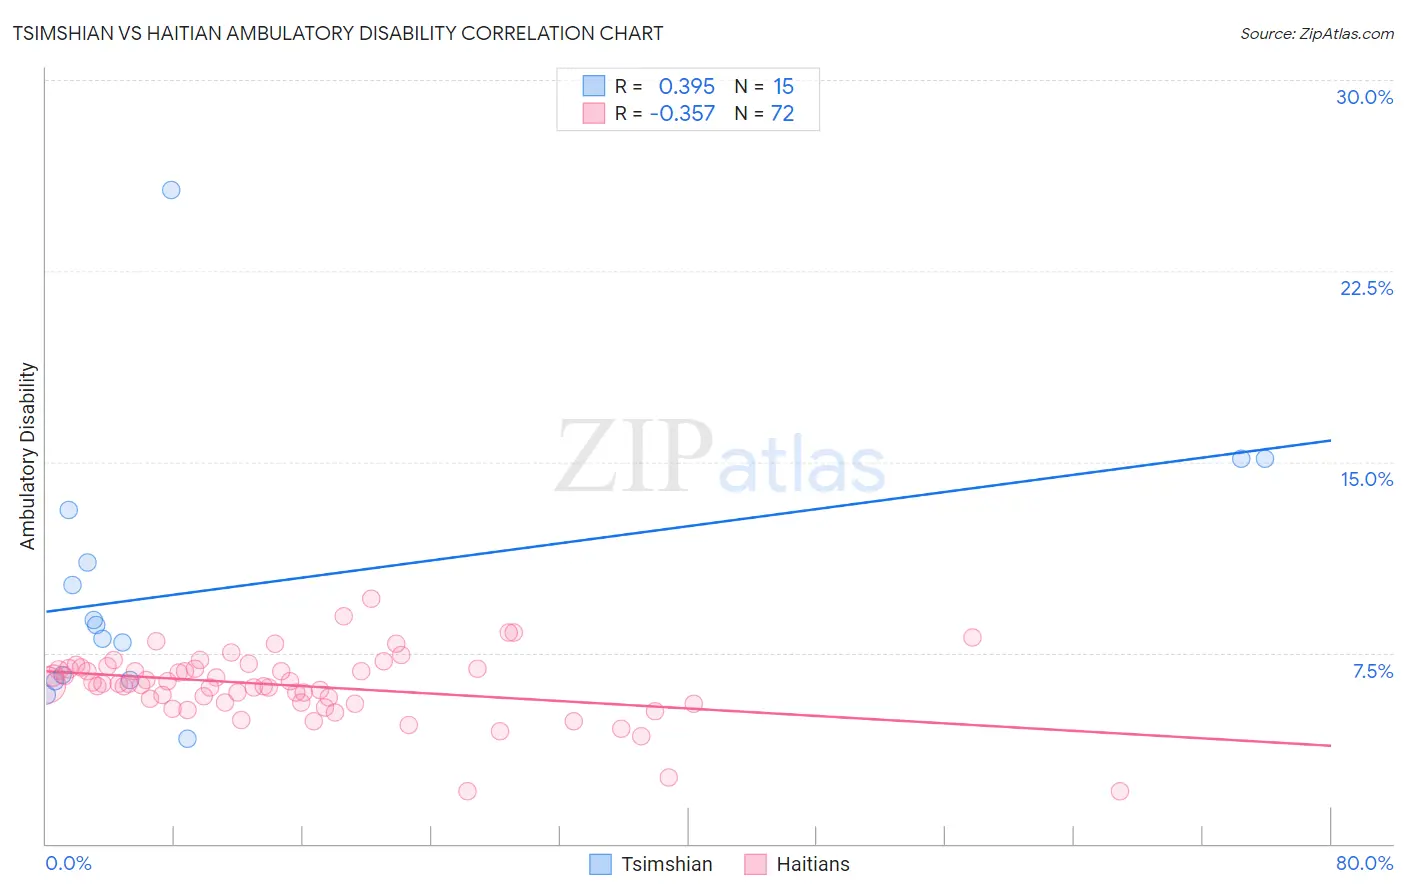
Tsimshian vs Haitian Ambulatory Disability Correlation Chart
The statistical analysis conducted on geographies consisting of 15,626,544 people shows a mild positive correlation between the proportion of Tsimshian and percentage of population with ambulatory disability in the United States with a correlation coefficient (R) of 0.395 and weighted average of 8.8%. Similarly, the statistical analysis conducted on geographies consisting of 287,779,605 people shows a mild negative correlation between the proportion of Haitians and percentage of population with ambulatory disability in the United States with a correlation coefficient (R) of -0.357 and weighted average of 6.4%, a difference of 36.9%.
Ambulatory Disability Correlation Summary
| Measurement | Tsimshian | Haitian |
| Minimum | 4.1% | 2.1% |
| Maximum | 25.7% | 9.6% |
| Range | 21.5% | 7.6% |
| Mean | 10.2% | 6.2% |
| Median | 8.6% | 6.3% |
| Interquartile 25% (IQ1) | 6.5% | 5.5% |
| Interquartile 75% (IQ3) | 13.1% | 6.9% |
| Interquartile Range (IQR) | 6.6% | 1.3% |
| Standard Deviation (Sample) | 5.4% | 1.3% |
| Standard Deviation (Population) | 5.2% | 1.3% |
Similar Demographics by Ambulatory Disability
Demographics Similar to Tsimshian by Ambulatory Disability
In terms of ambulatory disability, the demographic groups most similar to Tsimshian are Puerto Rican (8.9%, a difference of 0.59%), Tohono O'odham (8.7%, a difference of 0.97%), Kiowa (8.6%, a difference of 2.5%), Creek (8.5%, a difference of 4.4%), and Houma (9.3%, a difference of 5.5%).
| Demographics | Rating | Rank | Ambulatory Disability |
| Cherokee | 0.0 /100 | #333 | Tragic 7.9% |
| Yuman | 0.0 /100 | #334 | Tragic 7.9% |
| Chickasaw | 0.0 /100 | #335 | Tragic 8.0% |
| Seminole | 0.0 /100 | #336 | Tragic 8.0% |
| Dutch West Indians | 0.0 /100 | #337 | Tragic 8.2% |
| Colville | 0.0 /100 | #338 | Tragic 8.2% |
| Pima | 0.0 /100 | #339 | Tragic 8.2% |
| Choctaw | 0.0 /100 | #340 | Tragic 8.3% |
| Creek | 0.0 /100 | #341 | Tragic 8.5% |
| Kiowa | 0.0 /100 | #342 | Tragic 8.6% |
| Tohono O'odham | 0.0 /100 | #343 | Tragic 8.7% |
| Tsimshian | 0.0 /100 | #344 | Tragic 8.8% |
| Puerto Ricans | 0.0 /100 | #345 | Tragic 8.9% |
| Houma | 0.0 /100 | #346 | Tragic 9.3% |
| Lumbee | 0.0 /100 | #347 | Tragic 9.5% |
Demographics Similar to Haitians by Ambulatory Disability
In terms of ambulatory disability, the demographic groups most similar to Haitians are Immigrants from Germany (6.4%, a difference of 0.010%), Senegalese (6.4%, a difference of 0.070%), Immigrants from Senegal (6.4%, a difference of 0.090%), Dutch (6.4%, a difference of 0.10%), and Immigrants from Haiti (6.5%, a difference of 0.18%).
| Demographics | Rating | Rank | Ambulatory Disability |
| Panamanians | 3.1 /100 | #231 | Tragic 6.4% |
| Assyrians/Chaldeans/Syriacs | 2.4 /100 | #232 | Tragic 6.4% |
| Sub-Saharan Africans | 2.3 /100 | #233 | Tragic 6.4% |
| Immigrants | Liberia | 2.3 /100 | #234 | Tragic 6.4% |
| Hispanics or Latinos | 2.2 /100 | #235 | Tragic 6.4% |
| Dutch | 2.0 /100 | #236 | Tragic 6.4% |
| Immigrants | Germany | 1.8 /100 | #237 | Tragic 6.4% |
| Haitians | 1.8 /100 | #238 | Tragic 6.4% |
| Senegalese | 1.7 /100 | #239 | Tragic 6.4% |
| Immigrants | Senegal | 1.7 /100 | #240 | Tragic 6.4% |
| Immigrants | Haiti | 1.6 /100 | #241 | Tragic 6.5% |
| Spaniards | 1.6 /100 | #242 | Tragic 6.5% |
| Germans | 1.5 /100 | #243 | Tragic 6.5% |
| Immigrants | Panama | 1.5 /100 | #244 | Tragic 6.5% |
| Tlingit-Haida | 1.5 /100 | #245 | Tragic 6.5% |