Trinidadian and Tobagonian vs Immigrants from Peru Disability Age 18 to 34
COMPARE
Trinidadian and Tobagonian
Immigrants from Peru
Disability Age 18 to 34
Disability Age 18 to 34 Comparison
Trinidadians and Tobagonians
Immigrants from Peru
6.0%
DISABILITY AGE 18 TO 34
99.5/ 100
METRIC RATING
65th/ 347
METRIC RANK
5.9%
DISABILITY AGE 18 TO 34
99.8/ 100
METRIC RATING
45th/ 347
METRIC RANK
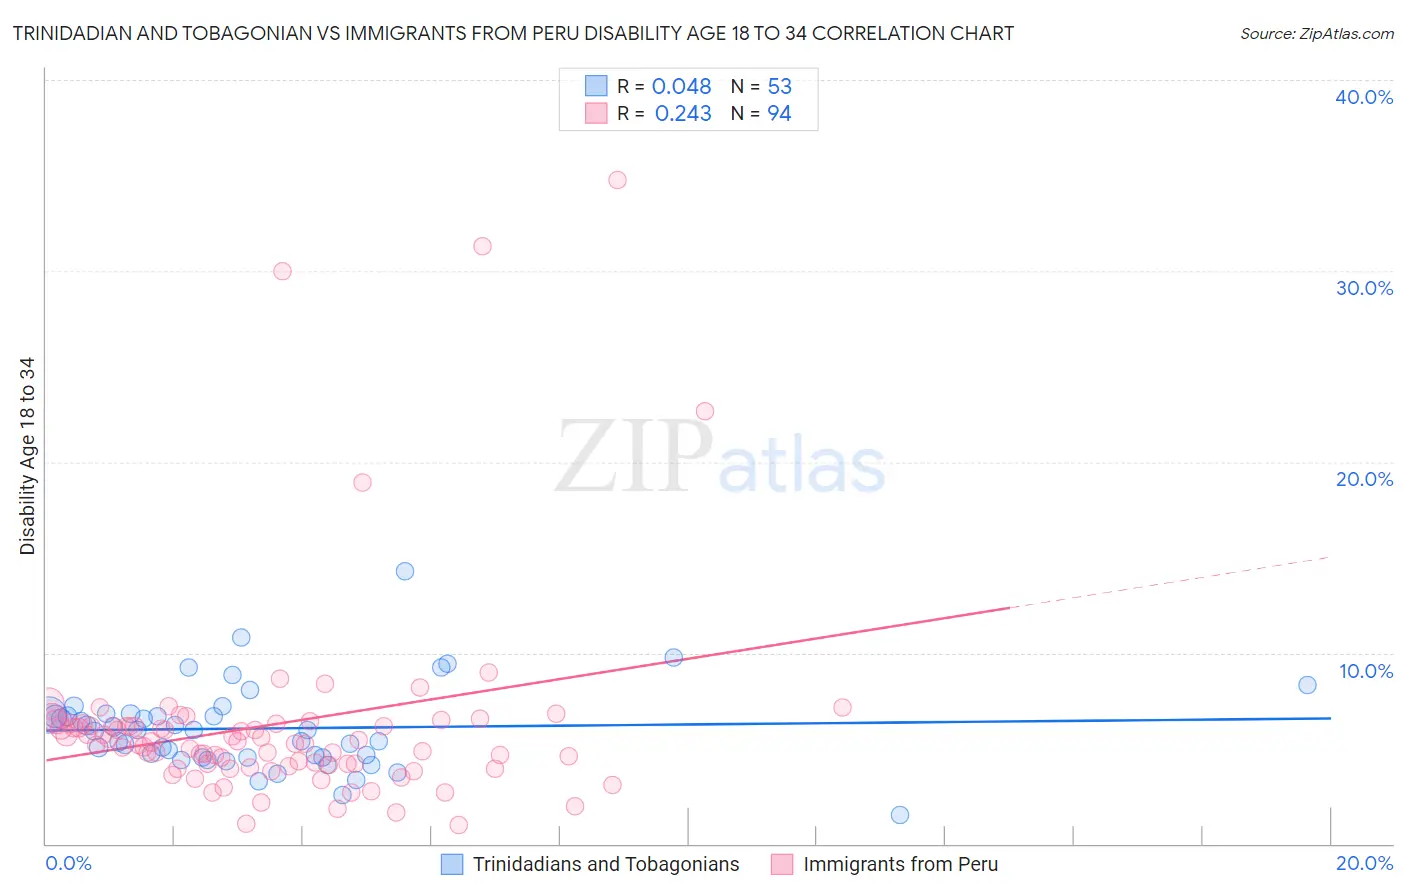
Trinidadian and Tobagonian vs Immigrants from Peru Disability Age 18 to 34 Correlation Chart
The statistical analysis conducted on geographies consisting of 219,707,802 people shows no correlation between the proportion of Trinidadians and Tobagonians and percentage of population with a disability between the ages 18 and 35 in the United States with a correlation coefficient (R) of 0.048 and weighted average of 6.0%. Similarly, the statistical analysis conducted on geographies consisting of 328,409,236 people shows a weak positive correlation between the proportion of Immigrants from Peru and percentage of population with a disability between the ages 18 and 35 in the United States with a correlation coefficient (R) of 0.243 and weighted average of 5.9%, a difference of 2.0%.
Disability Age 18 to 34 Correlation Summary
| Measurement | Trinidadian and Tobagonian | Immigrants from Peru |
| Minimum | 1.5% | 0.96% |
| Maximum | 14.3% | 34.7% |
| Range | 12.7% | 33.8% |
| Mean | 6.0% | 6.2% |
| Median | 5.9% | 5.3% |
| Interquartile 25% (IQ1) | 4.5% | 4.1% |
| Interquartile 75% (IQ3) | 6.8% | 6.3% |
| Interquartile Range (IQR) | 2.2% | 2.2% |
| Standard Deviation (Sample) | 2.2% | 5.5% |
| Standard Deviation (Population) | 2.2% | 5.5% |
Demographics Similar to Trinidadians and Tobagonians and Immigrants from Peru by Disability Age 18 to 34
In terms of disability age 18 to 34, the demographic groups most similar to Trinidadians and Tobagonians are Taiwanese (6.0%, a difference of 0.14%), Salvadoran (6.0%, a difference of 0.15%), Peruvian (6.0%, a difference of 0.21%), British West Indian (6.0%, a difference of 0.23%), and Immigrants from Caribbean (6.0%, a difference of 0.49%). Similarly, the demographic groups most similar to Immigrants from Peru are Immigrants from Korea (5.9%, a difference of 0.13%), Immigrants from Egypt (5.9%, a difference of 0.18%), Immigrants from Trinidad and Tobago (5.9%, a difference of 0.60%), Immigrants from Belarus (5.9%, a difference of 0.70%), and Immigrants from El Salvador (5.9%, a difference of 0.74%).
| Demographics | Rating | Rank | Disability Age 18 to 34 |
| Immigrants | Peru | 99.8 /100 | #45 | Exceptional 5.9% |
| Immigrants | Korea | 99.8 /100 | #46 | Exceptional 5.9% |
| Immigrants | Egypt | 99.8 /100 | #47 | Exceptional 5.9% |
| Immigrants | Trinidad and Tobago | 99.8 /100 | #48 | Exceptional 5.9% |
| Immigrants | Belarus | 99.8 /100 | #49 | Exceptional 5.9% |
| Immigrants | El Salvador | 99.8 /100 | #50 | Exceptional 5.9% |
| Egyptians | 99.8 /100 | #51 | Exceptional 5.9% |
| Okinawans | 99.7 /100 | #52 | Exceptional 5.9% |
| Immigrants | Indonesia | 99.7 /100 | #53 | Exceptional 5.9% |
| Immigrants | Malaysia | 99.7 /100 | #54 | Exceptional 5.9% |
| Immigrants | Spain | 99.7 /100 | #55 | Exceptional 5.9% |
| Paraguayans | 99.7 /100 | #56 | Exceptional 5.9% |
| Immigrants | Haiti | 99.7 /100 | #57 | Exceptional 5.9% |
| Immigrants | Serbia | 99.7 /100 | #58 | Exceptional 5.9% |
| Immigrants | Caribbean | 99.6 /100 | #59 | Exceptional 6.0% |
| Immigrants | Sri Lanka | 99.6 /100 | #60 | Exceptional 6.0% |
| British West Indians | 99.6 /100 | #61 | Exceptional 6.0% |
| Peruvians | 99.6 /100 | #62 | Exceptional 6.0% |
| Salvadorans | 99.6 /100 | #63 | Exceptional 6.0% |
| Taiwanese | 99.6 /100 | #64 | Exceptional 6.0% |
| Trinidadians and Tobagonians | 99.5 /100 | #65 | Exceptional 6.0% |