Trinidadian and Tobagonian vs Immigrants from Bangladesh Disability Age Over 75
COMPARE
Trinidadian and Tobagonian
Immigrants from Bangladesh
Disability Age Over 75
Disability Age Over 75 Comparison
Trinidadians and Tobagonians
Immigrants from Bangladesh
47.7%
DISABILITY AGE OVER 75
20.0/ 100
METRIC RATING
203rd/ 347
METRIC RANK
48.0%
DISABILITY AGE OVER 75
6.8/ 100
METRIC RATING
223rd/ 347
METRIC RANK
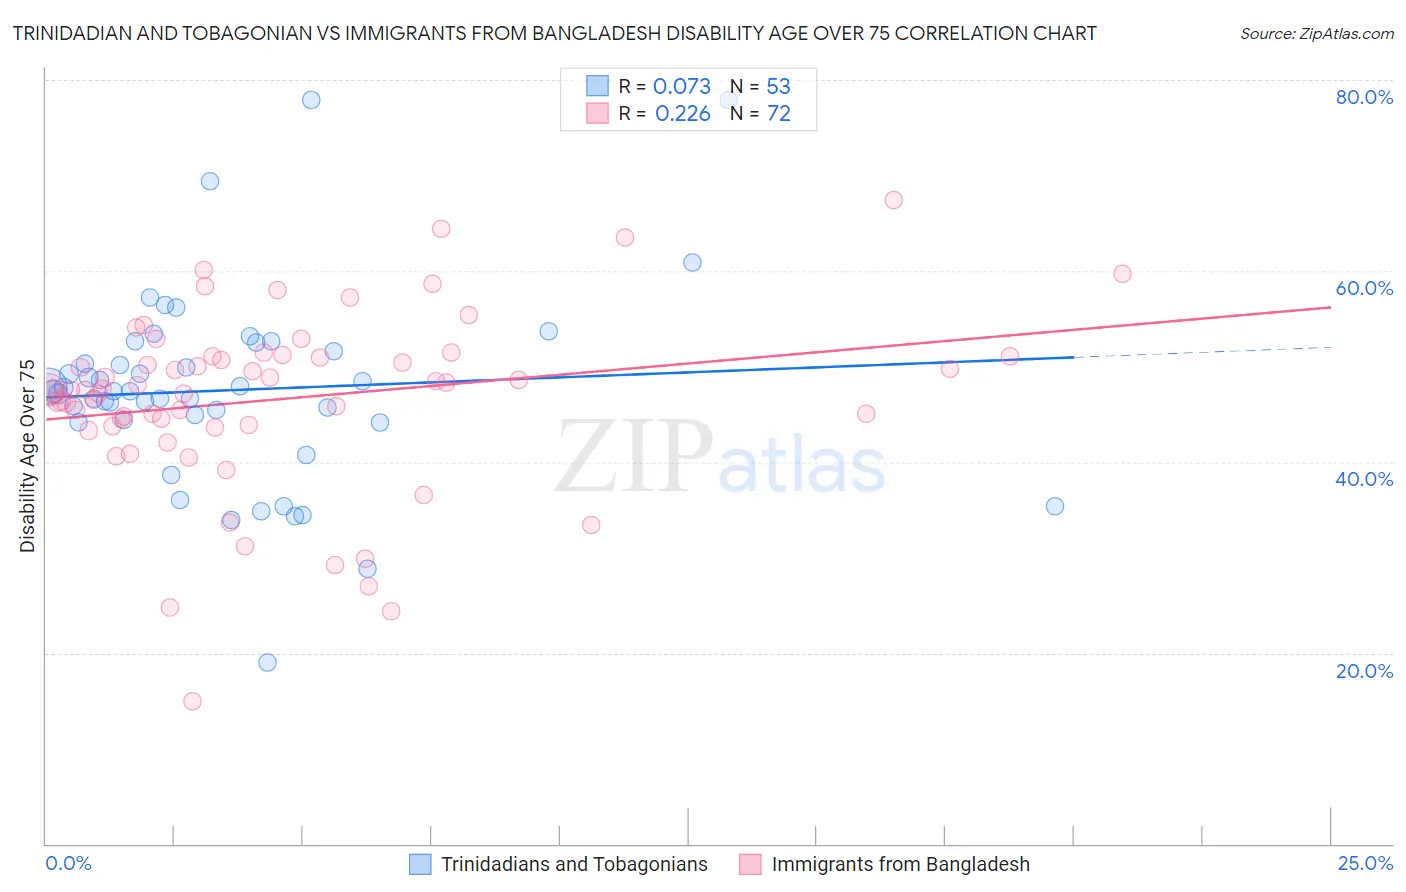
Trinidadian and Tobagonian vs Immigrants from Bangladesh Disability Age Over 75 Correlation Chart
The statistical analysis conducted on geographies consisting of 219,483,630 people shows a slight positive correlation between the proportion of Trinidadians and Tobagonians and percentage of population with a disability over the age of 75 in the United States with a correlation coefficient (R) of 0.073 and weighted average of 47.7%. Similarly, the statistical analysis conducted on geographies consisting of 203,443,317 people shows a weak positive correlation between the proportion of Immigrants from Bangladesh and percentage of population with a disability over the age of 75 in the United States with a correlation coefficient (R) of 0.226 and weighted average of 48.0%, a difference of 0.69%.
Disability Age Over 75 Correlation Summary
| Measurement | Trinidadian and Tobagonian | Immigrants from Bangladesh |
| Minimum | 18.9% | 14.9% |
| Maximum | 77.9% | 67.4% |
| Range | 59.0% | 52.4% |
| Mean | 47.5% | 46.6% |
| Median | 47.4% | 47.6% |
| Interquartile 25% (IQ1) | 44.3% | 43.8% |
| Interquartile 75% (IQ3) | 52.0% | 51.1% |
| Interquartile Range (IQR) | 7.7% | 7.3% |
| Standard Deviation (Sample) | 10.2% | 9.4% |
| Standard Deviation (Population) | 10.1% | 9.4% |
Demographics Similar to Trinidadians and Tobagonians and Immigrants from Bangladesh by Disability Age Over 75
In terms of disability age over 75, the demographic groups most similar to Trinidadians and Tobagonians are Nigerian (47.7%, a difference of 0.030%), Immigrants from Ghana (47.7%, a difference of 0.030%), Jamaican (47.7%, a difference of 0.040%), Immigrants from Syria (47.8%, a difference of 0.10%), and Immigrants from Senegal (47.8%, a difference of 0.12%). Similarly, the demographic groups most similar to Immigrants from Bangladesh are Barbadian (48.0%, a difference of 0.0%), Bahamian (48.0%, a difference of 0.050%), Immigrants from Oceania (48.0%, a difference of 0.050%), Immigrants from Western Asia (48.0%, a difference of 0.060%), and Immigrants from Western Africa (48.0%, a difference of 0.12%).
| Demographics | Rating | Rank | Disability Age Over 75 |
| Trinidadians and Tobagonians | 20.0 /100 | #203 | Fair 47.7% |
| Nigerians | 19.2 /100 | #204 | Poor 47.7% |
| Immigrants | Ghana | 19.1 /100 | #205 | Poor 47.7% |
| Jamaicans | 19.0 /100 | #206 | Poor 47.7% |
| Immigrants | Syria | 17.4 /100 | #207 | Poor 47.8% |
| Immigrants | Senegal | 16.9 /100 | #208 | Poor 47.8% |
| Immigrants | Indonesia | 14.2 /100 | #209 | Poor 47.8% |
| Vietnamese | 11.9 /100 | #210 | Poor 47.9% |
| Panamanians | 11.8 /100 | #211 | Poor 47.9% |
| Immigrants | Burma/Myanmar | 11.7 /100 | #212 | Poor 47.9% |
| Laotians | 11.5 /100 | #213 | Poor 47.9% |
| Immigrants | Barbados | 10.7 /100 | #214 | Poor 47.9% |
| Senegalese | 10.7 /100 | #215 | Poor 47.9% |
| Immigrants | Panama | 10.2 /100 | #216 | Poor 47.9% |
| Immigrants | Grenada | 9.4 /100 | #217 | Tragic 47.9% |
| Immigrants | Western Africa | 8.3 /100 | #218 | Tragic 48.0% |
| Immigrants | Western Asia | 7.5 /100 | #219 | Tragic 48.0% |
| Bahamians | 7.4 /100 | #220 | Tragic 48.0% |
| Immigrants | Oceania | 7.3 /100 | #221 | Tragic 48.0% |
| Barbadians | 6.8 /100 | #222 | Tragic 48.0% |
| Immigrants | Bangladesh | 6.8 /100 | #223 | Tragic 48.0% |