Luxembourger vs Immigrants from Zaire Cognitive Disability
COMPARE
Luxembourger
Immigrants from Zaire
Cognitive Disability
Cognitive Disability Comparison
Luxembourgers
Immigrants from Zaire
16.4%
COGNITIVE DISABILITY
99.9/ 100
METRIC RATING
25th/ 347
METRIC RANK
19.4%
COGNITIVE DISABILITY
0.0/ 100
METRIC RATING
343rd/ 347
METRIC RANK
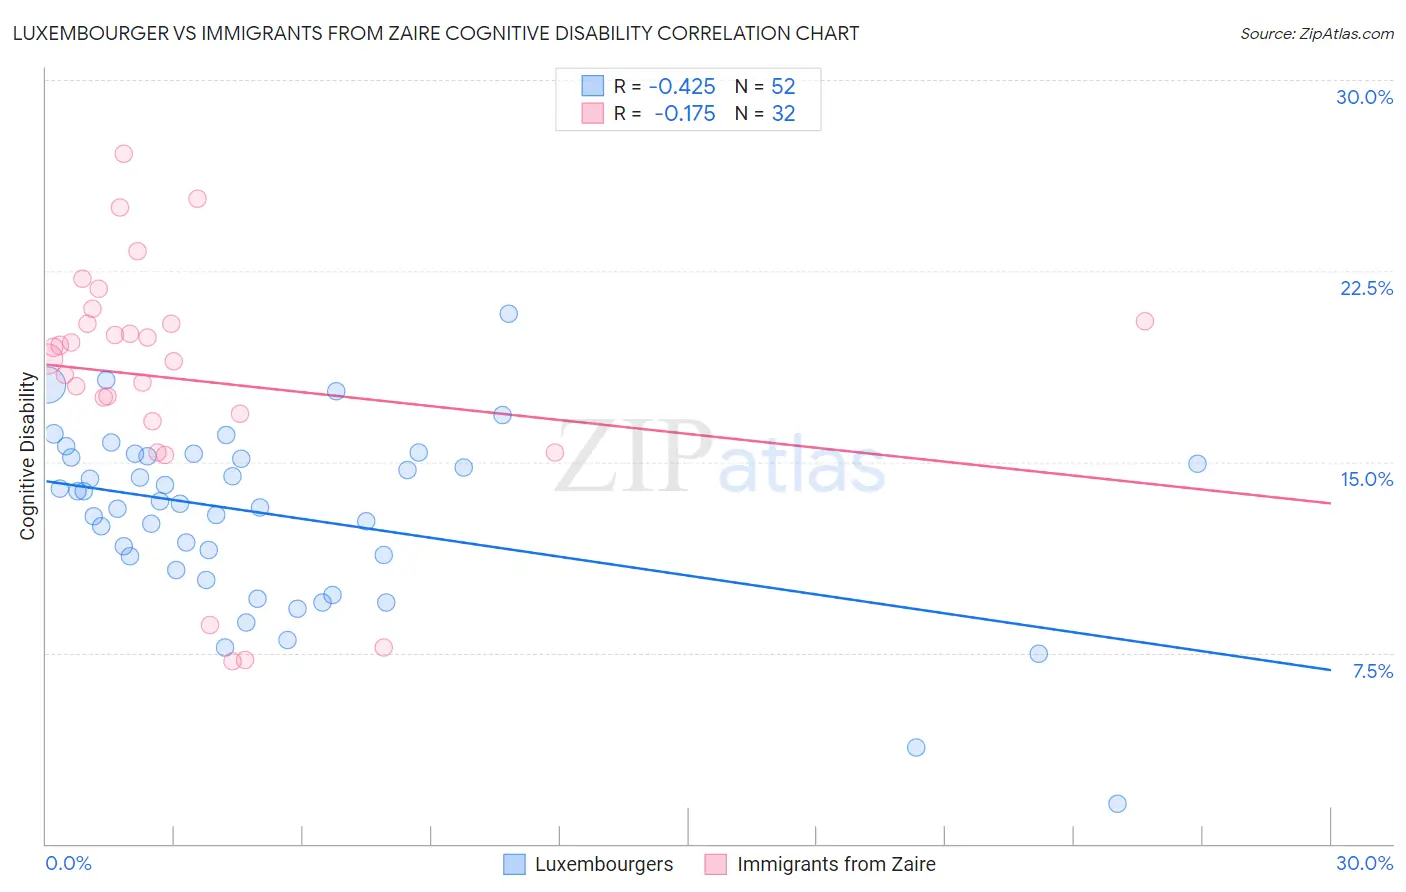
Luxembourger vs Immigrants from Zaire Cognitive Disability Correlation Chart
The statistical analysis conducted on geographies consisting of 144,680,571 people shows a moderate negative correlation between the proportion of Luxembourgers and percentage of population with cognitive disability in the United States with a correlation coefficient (R) of -0.425 and weighted average of 16.4%. Similarly, the statistical analysis conducted on geographies consisting of 107,255,223 people shows a poor negative correlation between the proportion of Immigrants from Zaire and percentage of population with cognitive disability in the United States with a correlation coefficient (R) of -0.175 and weighted average of 19.4%, a difference of 18.5%.
Cognitive Disability Correlation Summary
| Measurement | Luxembourger | Immigrants from Zaire |
| Minimum | 1.6% | 7.2% |
| Maximum | 20.8% | 27.1% |
| Range | 19.3% | 19.9% |
| Mean | 12.9% | 18.2% |
| Median | 13.4% | 19.3% |
| Interquartile 25% (IQ1) | 11.0% | 16.8% |
| Interquartile 75% (IQ3) | 15.2% | 20.5% |
| Interquartile Range (IQR) | 4.2% | 3.7% |
| Standard Deviation (Sample) | 3.5% | 4.9% |
| Standard Deviation (Population) | 3.5% | 4.8% |
Similar Demographics by Cognitive Disability
Demographics Similar to Luxembourgers by Cognitive Disability
In terms of cognitive disability, the demographic groups most similar to Luxembourgers are Immigrants from Croatia (16.4%, a difference of 0.030%), Immigrants from Argentina (16.4%, a difference of 0.040%), Immigrants from Pakistan (16.4%, a difference of 0.050%), Polish (16.4%, a difference of 0.050%), and Croatian (16.4%, a difference of 0.060%).
| Demographics | Rating | Rank | Cognitive Disability |
| Immigrants | Northern Europe | 100.0 /100 | #18 | Exceptional 16.3% |
| Immigrants | Bolivia | 100.0 /100 | #19 | Exceptional 16.3% |
| Bulgarians | 100.0 /100 | #20 | Exceptional 16.3% |
| Immigrants | Cuba | 100.0 /100 | #21 | Exceptional 16.3% |
| Immigrants | South Central Asia | 99.9 /100 | #22 | Exceptional 16.4% |
| Croatians | 99.9 /100 | #23 | Exceptional 16.4% |
| Immigrants | Argentina | 99.9 /100 | #24 | Exceptional 16.4% |
| Luxembourgers | 99.9 /100 | #25 | Exceptional 16.4% |
| Immigrants | Croatia | 99.9 /100 | #26 | Exceptional 16.4% |
| Immigrants | Pakistan | 99.9 /100 | #27 | Exceptional 16.4% |
| Poles | 99.9 /100 | #28 | Exceptional 16.4% |
| Filipinos | 99.9 /100 | #29 | Exceptional 16.4% |
| Czechs | 99.9 /100 | #30 | Exceptional 16.4% |
| Immigrants | Romania | 99.9 /100 | #31 | Exceptional 16.4% |
| Immigrants | Israel | 99.9 /100 | #32 | Exceptional 16.4% |
Demographics Similar to Immigrants from Zaire by Cognitive Disability
In terms of cognitive disability, the demographic groups most similar to Immigrants from Zaire are Tohono O'odham (19.3%, a difference of 0.69%), Houma (19.3%, a difference of 0.69%), Cape Verdean (19.2%, a difference of 0.93%), Puerto Rican (19.2%, a difference of 0.96%), and Lumbee (19.1%, a difference of 1.4%).
| Demographics | Rating | Rank | Cognitive Disability |
| Immigrants | Yemen | 0.0 /100 | #333 | Tragic 18.8% |
| Sudanese | 0.0 /100 | #334 | Tragic 18.9% |
| Senegalese | 0.0 /100 | #335 | Tragic 19.0% |
| Blacks/African Americans | 0.0 /100 | #336 | Tragic 19.0% |
| Immigrants | Saudi Arabia | 0.0 /100 | #337 | Tragic 19.1% |
| Lumbee | 0.0 /100 | #338 | Tragic 19.1% |
| Puerto Ricans | 0.0 /100 | #339 | Tragic 19.2% |
| Cape Verdeans | 0.0 /100 | #340 | Tragic 19.2% |
| Tohono O'odham | 0.0 /100 | #341 | Tragic 19.3% |
| Houma | 0.0 /100 | #342 | Tragic 19.3% |
| Immigrants | Zaire | 0.0 /100 | #343 | Tragic 19.4% |
| Immigrants | Congo | 0.0 /100 | #344 | Tragic 19.7% |
| Somalis | 0.0 /100 | #345 | Tragic 19.8% |
| Immigrants | Cabo Verde | 0.0 /100 | #346 | Tragic 19.9% |
| Immigrants | Somalia | 0.0 /100 | #347 | Tragic 20.0% |