Tohono O'odham vs Brazilian Unemployment Among Ages 30 to 34 years
COMPARE
Tohono O'odham
Brazilian
Unemployment Among Ages 30 to 34 years
Unemployment Among Ages 30 to 34 years Comparison
Tohono O'odham
Brazilians
9.8%
UNEMPLOYMENT AMONG AGES 30 TO 34 YEARS
0.0/ 100
METRIC RATING
339th/ 347
METRIC RANK
5.4%
UNEMPLOYMENT AMONG AGES 30 TO 34 YEARS
58.2/ 100
METRIC RATING
162nd/ 347
METRIC RANK
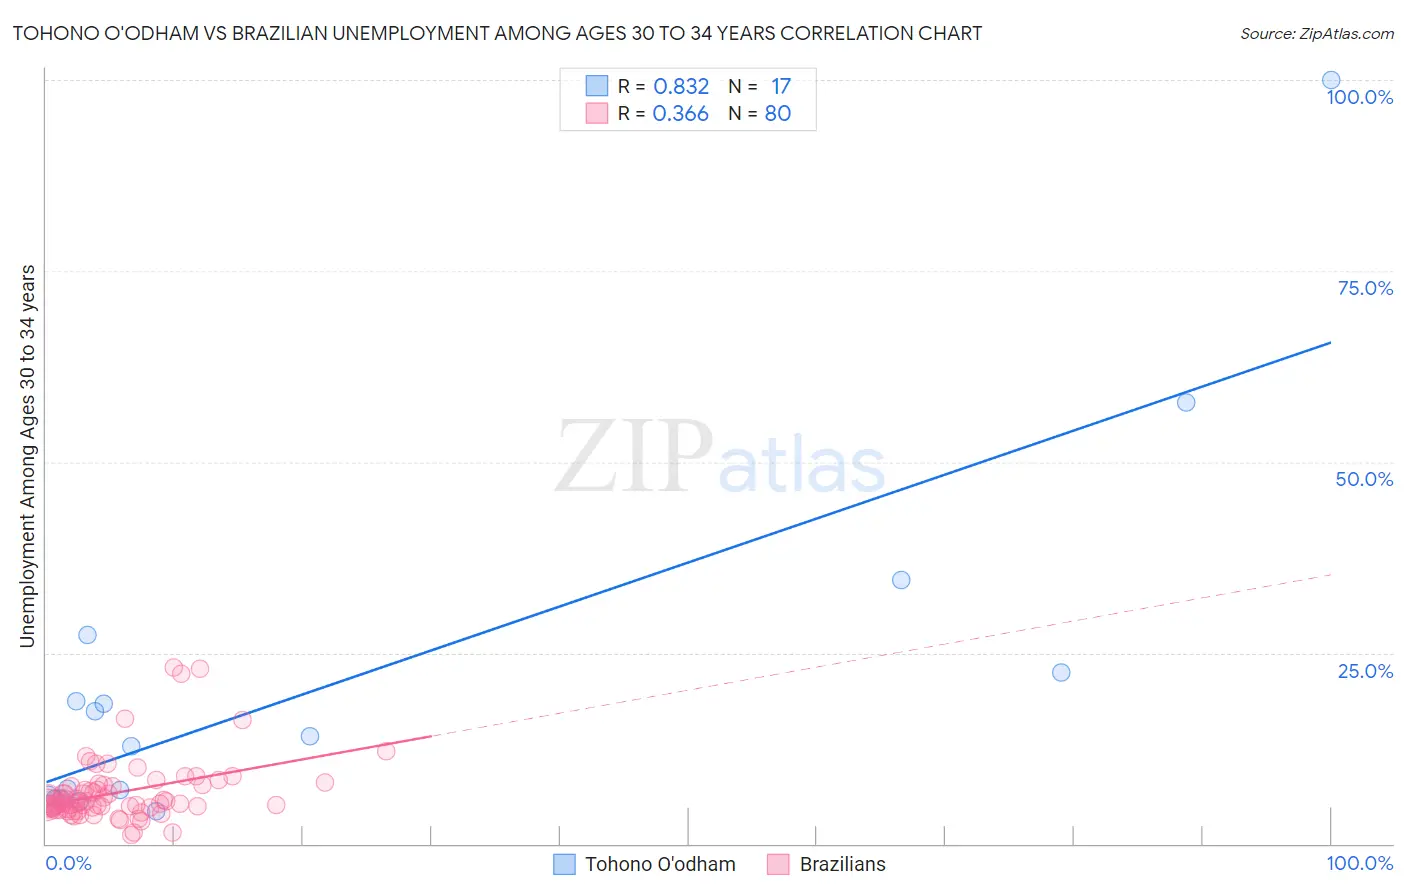
Tohono O'odham vs Brazilian Unemployment Among Ages 30 to 34 years Correlation Chart
The statistical analysis conducted on geographies consisting of 58,211,383 people shows a very strong positive correlation between the proportion of Tohono O'odham and unemployment rate among population between the ages 30 and 34 in the United States with a correlation coefficient (R) of 0.832 and weighted average of 9.8%. Similarly, the statistical analysis conducted on geographies consisting of 309,113,990 people shows a mild positive correlation between the proportion of Brazilians and unemployment rate among population between the ages 30 and 34 in the United States with a correlation coefficient (R) of 0.366 and weighted average of 5.4%, a difference of 81.0%.
Unemployment Among Ages 30 to 34 years Correlation Summary
| Measurement | Tohono O'odham | Brazilian |
| Minimum | 4.3% | 1.1% |
| Maximum | 100.0% | 23.1% |
| Range | 95.7% | 22.0% |
| Mean | 21.5% | 6.7% |
| Median | 14.1% | 5.3% |
| Interquartile 25% (IQ1) | 5.9% | 4.8% |
| Interquartile 75% (IQ3) | 24.9% | 7.6% |
| Interquartile Range (IQR) | 19.0% | 2.9% |
| Standard Deviation (Sample) | 24.4% | 4.2% |
| Standard Deviation (Population) | 23.7% | 4.1% |
Similar Demographics by Unemployment Among Ages 30 to 34 years
Demographics Similar to Tohono O'odham by Unemployment Among Ages 30 to 34 years
In terms of unemployment among ages 30 to 34 years, the demographic groups most similar to Tohono O'odham are Yakama (9.8%, a difference of 0.71%), Pima (9.6%, a difference of 1.9%), Crow (10.3%, a difference of 5.2%), Navajo (10.6%, a difference of 7.3%), and Yuman (10.6%, a difference of 7.8%).
| Demographics | Rating | Rank | Unemployment Among Ages 30 to 34 years |
| Natives/Alaskans | 0.0 /100 | #332 | Tragic 8.2% |
| Pueblo | 0.0 /100 | #333 | Tragic 8.3% |
| Alaska Natives | 0.0 /100 | #334 | Tragic 8.5% |
| Puerto Ricans | 0.0 /100 | #335 | Tragic 8.9% |
| Colville | 0.0 /100 | #336 | Tragic 9.0% |
| Pima | 0.0 /100 | #337 | Tragic 9.6% |
| Yakama | 0.0 /100 | #338 | Tragic 9.8% |
| Tohono O'odham | 0.0 /100 | #339 | Tragic 9.8% |
| Crow | 0.0 /100 | #340 | Tragic 10.3% |
| Navajo | 0.0 /100 | #341 | Tragic 10.6% |
| Yuman | 0.0 /100 | #342 | Tragic 10.6% |
| Inupiat | 0.0 /100 | #343 | Tragic 10.8% |
| Hopi | 0.0 /100 | #344 | Tragic 11.9% |
| Arapaho | 0.0 /100 | #345 | Tragic 12.8% |
| Tsimshian | 0.0 /100 | #346 | Tragic 13.8% |
Demographics Similar to Brazilians by Unemployment Among Ages 30 to 34 years
In terms of unemployment among ages 30 to 34 years, the demographic groups most similar to Brazilians are Arab (5.4%, a difference of 0.040%), Austrian (5.4%, a difference of 0.050%), Basque (5.4%, a difference of 0.060%), Immigrants from Scotland (5.4%, a difference of 0.080%), and Welsh (5.4%, a difference of 0.14%).
| Demographics | Rating | Rank | Unemployment Among Ages 30 to 34 years |
| Immigrants | Hungary | 66.1 /100 | #155 | Good 5.4% |
| Czechoslovakians | 63.7 /100 | #156 | Good 5.4% |
| Albanians | 63.7 /100 | #157 | Good 5.4% |
| Immigrants | Belarus | 62.7 /100 | #158 | Good 5.4% |
| Immigrants | Croatia | 61.0 /100 | #159 | Good 5.4% |
| Immigrants | Scotland | 59.3 /100 | #160 | Average 5.4% |
| Austrians | 59.0 /100 | #161 | Average 5.4% |
| Brazilians | 58.2 /100 | #162 | Average 5.4% |
| Arabs | 57.7 /100 | #163 | Average 5.4% |
| Basques | 57.3 /100 | #164 | Average 5.4% |
| Welsh | 56.3 /100 | #165 | Average 5.4% |
| Immigrants | Thailand | 55.6 /100 | #166 | Average 5.4% |
| English | 54.8 /100 | #167 | Average 5.4% |
| South Americans | 52.9 /100 | #168 | Average 5.4% |
| Immigrants | Israel | 52.9 /100 | #169 | Average 5.4% |