Taiwanese vs Immigrants from Canada Female Disability
COMPARE
Taiwanese
Immigrants from Canada
Female Disability
Female Disability Comparison
Taiwanese
Immigrants from Canada
11.4%
FEMALE DISABILITY
99.9/ 100
METRIC RATING
56th/ 347
METRIC RANK
12.3%
FEMALE DISABILITY
37.2/ 100
METRIC RATING
181st/ 347
METRIC RANK
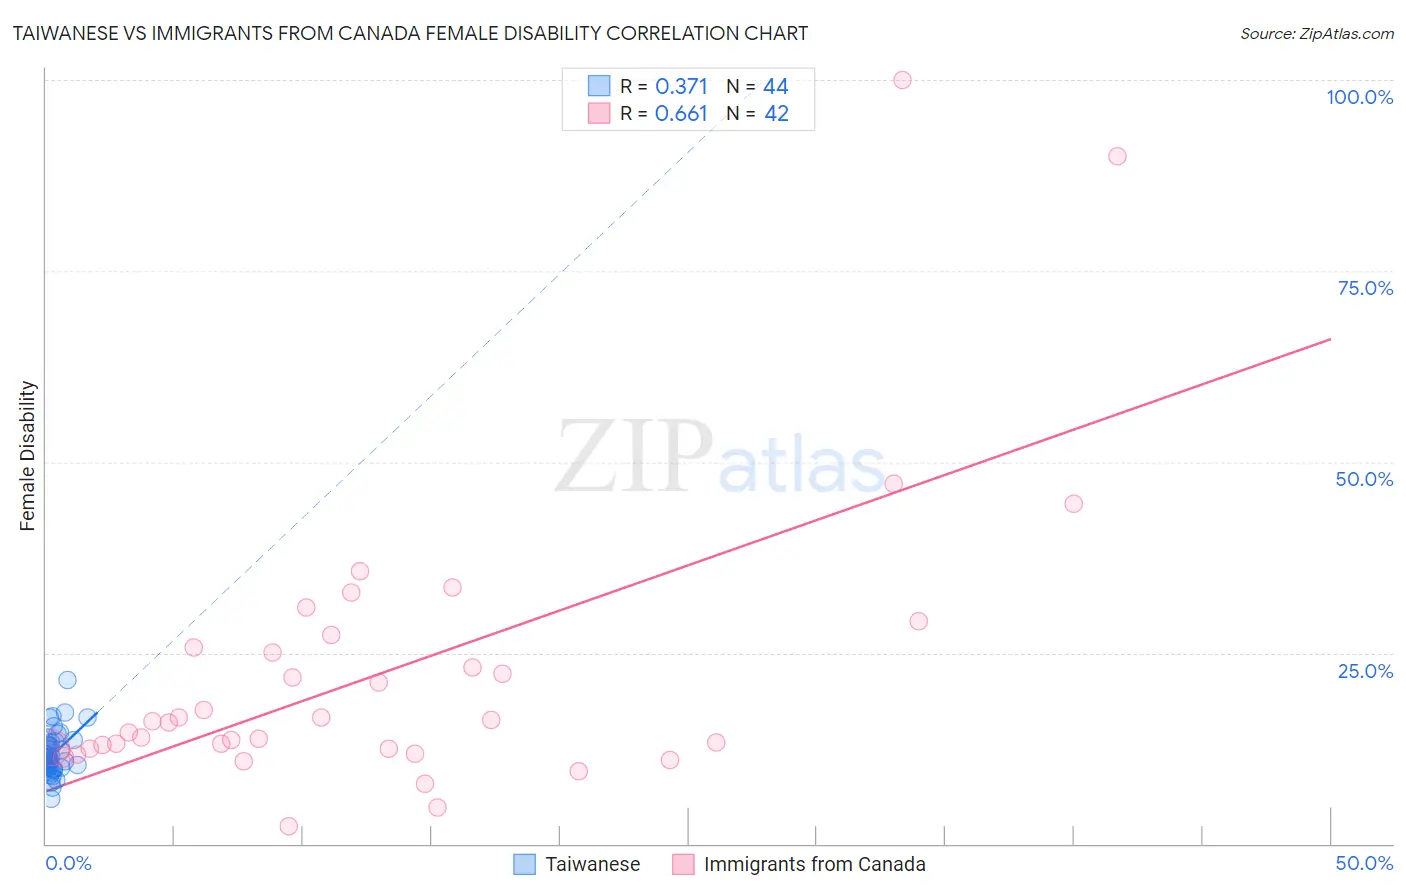
Taiwanese vs Immigrants from Canada Female Disability Correlation Chart
The statistical analysis conducted on geographies consisting of 31,724,936 people shows a mild positive correlation between the proportion of Taiwanese and percentage of females with a disability in the United States with a correlation coefficient (R) of 0.371 and weighted average of 11.4%. Similarly, the statistical analysis conducted on geographies consisting of 459,343,053 people shows a significant positive correlation between the proportion of Immigrants from Canada and percentage of females with a disability in the United States with a correlation coefficient (R) of 0.661 and weighted average of 12.3%, a difference of 7.9%.
Female Disability Correlation Summary
| Measurement | Taiwanese | Immigrants from Canada |
| Minimum | 5.9% | 2.3% |
| Maximum | 21.4% | 100.0% |
| Range | 15.5% | 97.7% |
| Mean | 11.8% | 22.3% |
| Median | 11.2% | 16.0% |
| Interquartile 25% (IQ1) | 10.0% | 12.5% |
| Interquartile 75% (IQ3) | 13.3% | 25.7% |
| Interquartile Range (IQR) | 3.4% | 13.2% |
| Standard Deviation (Sample) | 2.9% | 19.2% |
| Standard Deviation (Population) | 2.9% | 19.0% |
Similar Demographics by Female Disability
Demographics Similar to Taiwanese by Female Disability
In terms of female disability, the demographic groups most similar to Taiwanese are South American (11.4%, a difference of 0.080%), Laotian (11.4%, a difference of 0.090%), Bulgarian (11.3%, a difference of 0.23%), Immigrants from Spain (11.4%, a difference of 0.23%), and Peruvian (11.3%, a difference of 0.25%).
| Demographics | Rating | Rank | Female Disability |
| Tongans | 100.0 /100 | #49 | Exceptional 11.3% |
| Inupiat | 100.0 /100 | #50 | Exceptional 11.3% |
| Immigrants | Belgium | 100.0 /100 | #51 | Exceptional 11.3% |
| Immigrants | Peru | 99.9 /100 | #52 | Exceptional 11.3% |
| Immigrants | Saudi Arabia | 99.9 /100 | #53 | Exceptional 11.3% |
| Peruvians | 99.9 /100 | #54 | Exceptional 11.3% |
| Bulgarians | 99.9 /100 | #55 | Exceptional 11.3% |
| Taiwanese | 99.9 /100 | #56 | Exceptional 11.4% |
| South Americans | 99.9 /100 | #57 | Exceptional 11.4% |
| Laotians | 99.9 /100 | #58 | Exceptional 11.4% |
| Immigrants | Spain | 99.9 /100 | #59 | Exceptional 11.4% |
| Immigrants | Bulgaria | 99.9 /100 | #60 | Exceptional 11.4% |
| Immigrants | France | 99.9 /100 | #61 | Exceptional 11.4% |
| Sri Lankans | 99.9 /100 | #62 | Exceptional 11.4% |
| Immigrants | Colombia | 99.9 /100 | #63 | Exceptional 11.4% |
Demographics Similar to Immigrants from Canada by Female Disability
In terms of female disability, the demographic groups most similar to Immigrants from Canada are Norwegian (12.3%, a difference of 0.010%), Albanian (12.3%, a difference of 0.030%), Cuban (12.3%, a difference of 0.030%), Immigrants from Fiji (12.3%, a difference of 0.040%), and Iraqi (12.3%, a difference of 0.050%).
| Demographics | Rating | Rank | Female Disability |
| Immigrants | England | 50.0 /100 | #174 | Average 12.2% |
| Immigrants | St. Vincent and the Grenadines | 49.7 /100 | #175 | Average 12.2% |
| Immigrants | Guyana | 43.1 /100 | #176 | Average 12.2% |
| Immigrants | Ghana | 42.5 /100 | #177 | Average 12.2% |
| Immigrants | Western Europe | 40.9 /100 | #178 | Average 12.2% |
| Immigrants | Fiji | 38.2 /100 | #179 | Fair 12.3% |
| Albanians | 37.9 /100 | #180 | Fair 12.3% |
| Immigrants | Canada | 37.2 /100 | #181 | Fair 12.3% |
| Norwegians | 36.9 /100 | #182 | Fair 12.3% |
| Cubans | 36.5 /100 | #183 | Fair 12.3% |
| Iraqis | 36.0 /100 | #184 | Fair 12.3% |
| Immigrants | Uzbekistan | 33.9 /100 | #185 | Fair 12.3% |
| Austrians | 33.3 /100 | #186 | Fair 12.3% |
| Serbians | 33.1 /100 | #187 | Fair 12.3% |
| Immigrants | North America | 32.8 /100 | #188 | Fair 12.3% |