Immigrants from Caribbean vs Immigrants from Belize Vision Disability
COMPARE
Immigrants from Caribbean
Immigrants from Belize
Vision Disability
Vision Disability Comparison
Immigrants from Caribbean
Immigrants from Belize
2.5%
VISION DISABILITY
0.0/ 100
METRIC RATING
282nd/ 347
METRIC RANK
2.4%
VISION DISABILITY
0.1/ 100
METRIC RATING
263rd/ 347
METRIC RANK
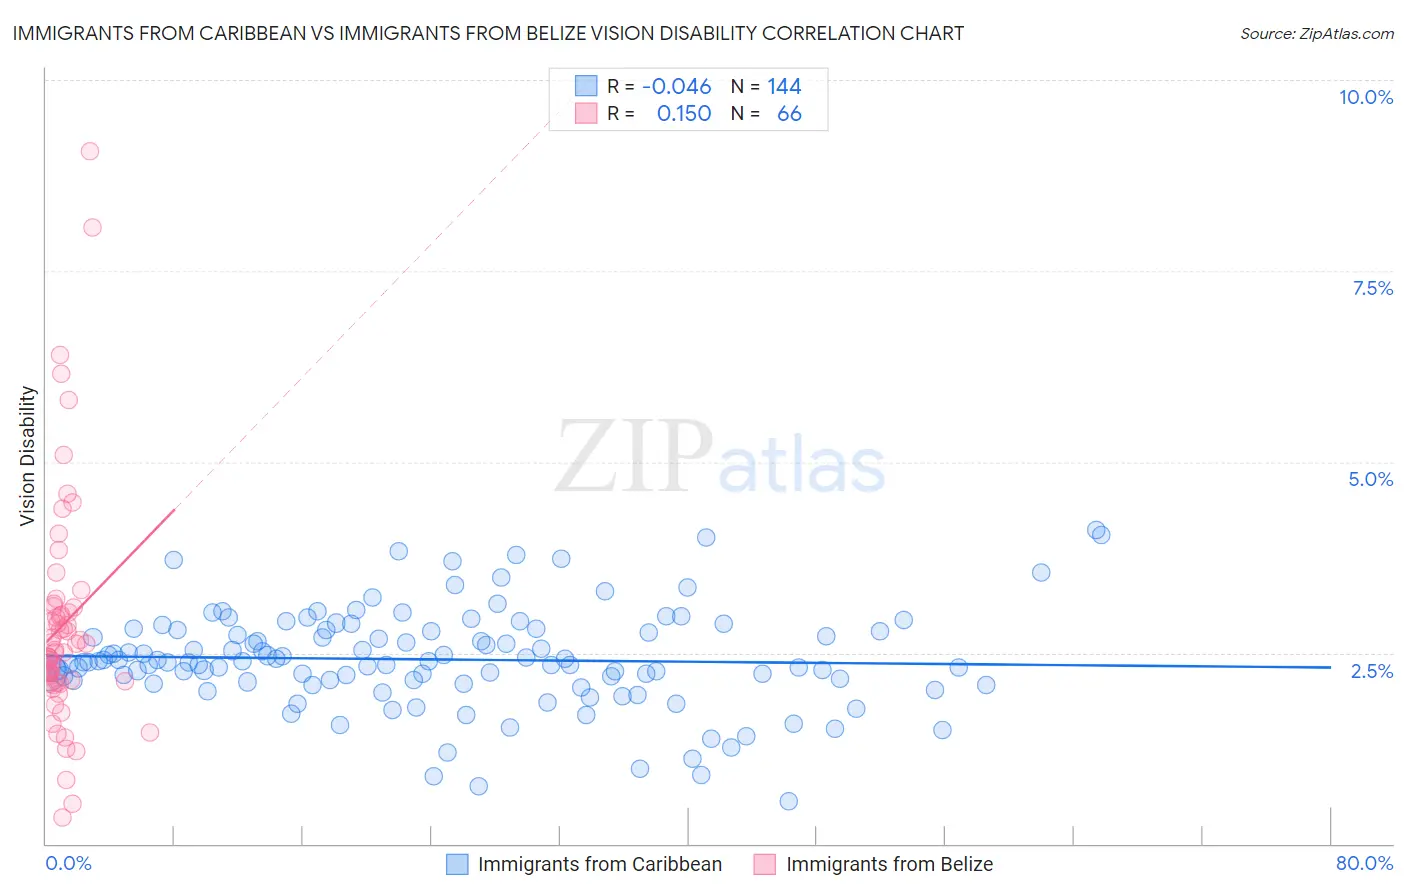
Immigrants from Caribbean vs Immigrants from Belize Vision Disability Correlation Chart
The statistical analysis conducted on geographies consisting of 449,351,147 people shows no correlation between the proportion of Immigrants from Caribbean and percentage of population with vision disability in the United States with a correlation coefficient (R) of -0.046 and weighted average of 2.5%. Similarly, the statistical analysis conducted on geographies consisting of 130,278,815 people shows a poor positive correlation between the proportion of Immigrants from Belize and percentage of population with vision disability in the United States with a correlation coefficient (R) of 0.150 and weighted average of 2.4%, a difference of 2.5%.
Vision Disability Correlation Summary
| Measurement | Immigrants from Caribbean | Immigrants from Belize |
| Minimum | 0.56% | 0.34% |
| Maximum | 4.1% | 9.1% |
| Range | 3.5% | 8.7% |
| Mean | 2.4% | 2.9% |
| Median | 2.4% | 2.5% |
| Interquartile 25% (IQ1) | 2.1% | 2.1% |
| Interquartile 75% (IQ3) | 2.8% | 3.1% |
| Interquartile Range (IQR) | 0.66% | 0.99% |
| Standard Deviation (Sample) | 0.65% | 1.5% |
| Standard Deviation (Population) | 0.65% | 1.5% |
Demographics Similar to Immigrants from Caribbean and Immigrants from Belize by Vision Disability
In terms of vision disability, the demographic groups most similar to Immigrants from Caribbean are U.S. Virgin Islander (2.5%, a difference of 0.12%), Cape Verdean (2.4%, a difference of 0.35%), Nepalese (2.4%, a difference of 0.39%), Spanish (2.4%, a difference of 0.40%), and Bahamian (2.4%, a difference of 0.56%). Similarly, the demographic groups most similar to Immigrants from Belize are Immigrants from Liberia (2.4%, a difference of 0.12%), Immigrants from Jamaica (2.4%, a difference of 0.14%), Mexican American Indian (2.4%, a difference of 0.19%), Ute (2.4%, a difference of 0.20%), and Jamaican (2.4%, a difference of 0.26%).
| Demographics | Rating | Rank | Vision Disability |
| Jamaicans | 0.1 /100 | #262 | Tragic 2.4% |
| Immigrants | Belize | 0.1 /100 | #263 | Tragic 2.4% |
| Immigrants | Liberia | 0.1 /100 | #264 | Tragic 2.4% |
| Immigrants | Jamaica | 0.1 /100 | #265 | Tragic 2.4% |
| Mexican American Indians | 0.1 /100 | #266 | Tragic 2.4% |
| Ute | 0.1 /100 | #267 | Tragic 2.4% |
| Senegalese | 0.1 /100 | #268 | Tragic 2.4% |
| Celtics | 0.1 /100 | #269 | Tragic 2.4% |
| Cubans | 0.1 /100 | #270 | Tragic 2.4% |
| Immigrants | Azores | 0.1 /100 | #271 | Tragic 2.4% |
| Spaniards | 0.1 /100 | #272 | Tragic 2.4% |
| Immigrants | Bahamas | 0.1 /100 | #273 | Tragic 2.4% |
| Immigrants | Latin America | 0.0 /100 | #274 | Tragic 2.4% |
| Chippewa | 0.0 /100 | #275 | Tragic 2.4% |
| Scotch-Irish | 0.0 /100 | #276 | Tragic 2.4% |
| Bahamians | 0.0 /100 | #277 | Tragic 2.4% |
| Spanish | 0.0 /100 | #278 | Tragic 2.4% |
| Nepalese | 0.0 /100 | #279 | Tragic 2.4% |
| Cape Verdeans | 0.0 /100 | #280 | Tragic 2.4% |
| U.S. Virgin Islanders | 0.0 /100 | #281 | Tragic 2.5% |
| Immigrants | Caribbean | 0.0 /100 | #282 | Tragic 2.5% |