Swiss vs Immigrants from Nigeria Disability Age Over 75

COMPARE

Swiss
Race
Ancestry
AfghanAfricanAlaska NativeAlaskan AthabascanAlbanianAleutAlsatianAmericanApacheArabArapahoArgentineanArmenianAssyrian/Chaldean/SyriacAustralianAustrianBahamianBangladeshiBarbadianBasqueBelgianBelizeanBermudanBhutaneseBlackfeetBolivianBrazilianBritishBritish West IndianBulgarianBurmeseCajunCambodianCanadianCape VerdeanCarpatho RusynCelticCentral AmericanCentral American IndianCherokeeCheyenneChickasawChileanChineseChippewaChoctawColombianColvilleComancheCosta RicanCreeCreekCroatianCrowCubanCypriotCzechCzechoslovakianDanishDelawareDominicanDutchDutch West IndianEastern EuropeanEcuadorianEgyptianEnglishEstonianEthiopianEuropeanFijianFilipinoFinnishFrenchFrench American IndianFrench CanadianGermanGerman RussianGhanaianGreekGuamanian/ChamorroGuatemalanGuyaneseHaitianHmongHonduranHopiHoumaHungarianIcelanderIndian (Asian)IndonesianInupiatIranianIraqiIrishIroquoisIsraeliItalianJamaicanJapaneseJordanianKenyanKiowaKoreanLaotianLatvianLebaneseLiberianLithuanianLumbeeLuxembourgerMacedonianMalaysianMalteseMarshalleseMenomineeMexicanMexican American IndianMongolianMoroccanNative HawaiianNavajoNepaleseNew ZealanderNicaraguanNigerianNorthern EuropeanNorwegianOkinawanOsageOttawaPaiutePakistaniPalestinianPanamanianParaguayanPennsylvania GermanPeruvianPimaPolishPortuguesePotawatomiPuebloPuerto RicanPuget Sound SalishRomanianRussianSalvadoranSamoanScandinavianScotch-IrishScottishSeminoleSenegaleseSerbianShoshoneSierra LeoneanSiouxSlavicSlovakSloveneSomaliSouth AfricanSouth AmericanSouth American IndianSoviet UnionSpaniardSpanishSpanish AmericanSpanish American IndianSri LankanSubsaharan AfricanSudaneseSwedishSwissSyrianTaiwaneseThaiTlingit-HaidaTohono O'OdhamTonganTrinidadian and TobagonianTsimshianTurkishU.S. Virgin IslanderUgandanUkrainianUruguayanUteVenezuelanVietnameseWelshWest IndianYakamaYaquiYugoslavianYumanYup'ikZimbabwean
Immigration
NonimmigrantsImmigrantsAfghanistanAfricaAlbaniaArgentinaArmeniaAsiaAustraliaAustriaBahamasBangladeshBarbadosBelarusBelgiumBelizeBoliviaBosnia and HerzegovinaBrazilBulgariaBurma/MyanmarCabo VerdeCambodiaCameroonCanadaCaribbeanCentral AmericaChileChinaColombiaCongoCosta RicaCroatiaCubaCzechoslovakiaDenmarkDominicaDominican RepublicEastern AfricaEastern AsiaEastern EuropeEcuadorEgyptEl SalvadorEnglandEritreaEthiopiaEuropeFijiFranceGermanyGhanaGreeceGrenadaGuatemalaGuyanaHaitiHondurasHong KongHungaryIndiaIndonesiaIranIraqIrelandIsraelItalyJamaicaJapanJordanKazakhstanKenyaKoreaKuwaitLaosLatin AmericaLatviaLebanonLiberiaLithuaniaMalaysiaMexicoMicronesiaMiddle AfricaMoldovaMoroccoNepalNetherlandsNicaraguaNorth AmericaNorth MacedoniaNorthern AfricaNorthern EuropeNorwayOceaniaPakistanPanamaPeruPhilippinesPolandPortugalRomaniaRussiaSaudi ArabiaScotlandSenegalSerbiaSierra LeoneSingaporeSomaliaSouth AfricaSouth AmericaSouth Central AsiaSouth Eastern AsiaSouthern EuropeSpainSri LankaSt. Vincent and the GrenadinesSudanSwedenSwitzerlandSyriaTaiwanThailandTrinidad and TobagoTurkeyUgandaUkraineUruguayUzbekistanVenezuelaVietnamWest IndiesWestern AfricaWestern AsiaWestern EuropeYemenZaireZimbabweAzores
Immigrants from Nigeria
Race
Ancestry
AfghanAfricanAlaska NativeAlaskan AthabascanAlbanianAleutAlsatianAmericanApacheArabArapahoArgentineanArmenianAssyrian/Chaldean/SyriacAustralianAustrianBahamianBangladeshiBarbadianBasqueBelgianBelizeanBermudanBhutaneseBlackfeetBolivianBrazilianBritishBritish West IndianBulgarianBurmeseCajunCambodianCanadianCape VerdeanCarpatho RusynCelticCentral AmericanCentral American IndianCherokeeCheyenneChickasawChileanChineseChippewaChoctawColombianColvilleComancheCosta RicanCreeCreekCroatianCrowCubanCypriotCzechCzechoslovakianDanishDelawareDominicanDutchDutch West IndianEastern EuropeanEcuadorianEgyptianEnglishEstonianEthiopianEuropeanFijianFilipinoFinnishFrenchFrench American IndianFrench CanadianGermanGerman RussianGhanaianGreekGuamanian/ChamorroGuatemalanGuyaneseHaitianHmongHonduranHopiHoumaHungarianIcelanderIndian (Asian)IndonesianInupiatIranianIraqiIrishIroquoisIsraeliItalianJamaicanJapaneseJordanianKenyanKiowaKoreanLaotianLatvianLebaneseLiberianLithuanianLumbeeLuxembourgerMacedonianMalaysianMalteseMarshalleseMenomineeMexicanMexican American IndianMongolianMoroccanNative HawaiianNavajoNepaleseNew ZealanderNicaraguanNigerianNorthern EuropeanNorwegianOkinawanOsageOttawaPaiutePakistaniPalestinianPanamanianParaguayanPennsylvania GermanPeruvianPimaPolishPortuguesePotawatomiPuebloPuerto RicanPuget Sound SalishRomanianRussianSalvadoranSamoanScandinavianScotch-IrishScottishSeminoleSenegaleseSerbianShoshoneSierra LeoneanSiouxSlavicSlovakSloveneSomaliSouth AfricanSouth AmericanSouth American IndianSoviet UnionSpaniardSpanishSpanish AmericanSpanish American IndianSri LankanSubsaharan AfricanSudaneseSwedishSyrianTaiwaneseThaiTlingit-HaidaTohono O'OdhamTonganTrinidadian and TobagonianTsimshianTurkishU.S. Virgin IslanderUgandanUkrainianUruguayanUteVenezuelanVietnameseWelshWest IndianYakamaYaquiYugoslavianYumanYup'ikZimbabwean
Immigration
NonimmigrantsImmigrantsAfghanistanAfricaAlbaniaArgentinaArmeniaAsiaAustraliaAustriaBahamasBangladeshBarbadosBelarusBelgiumBelizeBoliviaBosnia and HerzegovinaBrazilBulgariaBurma/MyanmarCabo VerdeCambodiaCameroonCanadaCaribbeanCentral AmericaChileChinaColombiaCongoCosta RicaCroatiaCubaCzechoslovakiaDenmarkDominicaDominican RepublicEastern AfricaEastern AsiaEastern EuropeEcuadorEgyptEl SalvadorEnglandEritreaEthiopiaEuropeFijiFranceGermanyGhanaGreeceGrenadaGuatemalaGuyanaHaitiHondurasHong KongHungaryIndiaIndonesiaIranIraqIrelandIsraelItalyJamaicaJapanJordanKazakhstanKenyaKoreaKuwaitLaosLatin AmericaLatviaLebanonLiberiaLithuaniaMalaysiaMexicoMicronesiaMiddle AfricaMoldovaMoroccoNepalNetherlandsNicaraguaNigeriaNorth AmericaNorth MacedoniaNorthern AfricaNorthern EuropeNorwayOceaniaPakistanPanamaPeruPhilippinesPolandPortugalRomaniaRussiaSaudi ArabiaScotlandSenegalSerbiaSierra LeoneSingaporeSomaliaSouth AfricaSouth AmericaSouth Central AsiaSouth Eastern AsiaSouthern EuropeSpainSri LankaSt. Vincent and the GrenadinesSudanSwedenSwitzerlandSyriaTaiwanThailandTrinidad and TobagoTurkeyUgandaUkraineUruguayUzbekistanVenezuelaVietnamWest IndiesWestern AfricaWestern AsiaWestern EuropeYemenZaireZimbabweAzores
Disability Age Over 75
Income
Poverty
Unemployment
Labor Participation
Family Structure
Vehicle Availability
Education Level
Disability

Disability Age Over 75 Comparison

Swiss

Immigrants from Nigeria

Exceptional
Fair
46.2%
DISABILITY AGE OVER 75
98.8/ 100
METRIC RATING
79th/ 347
METRIC RANK
47.5%
DISABILITY AGE OVER 75
34.0/ 100
METRIC RATING
184th/ 347
METRIC RANK

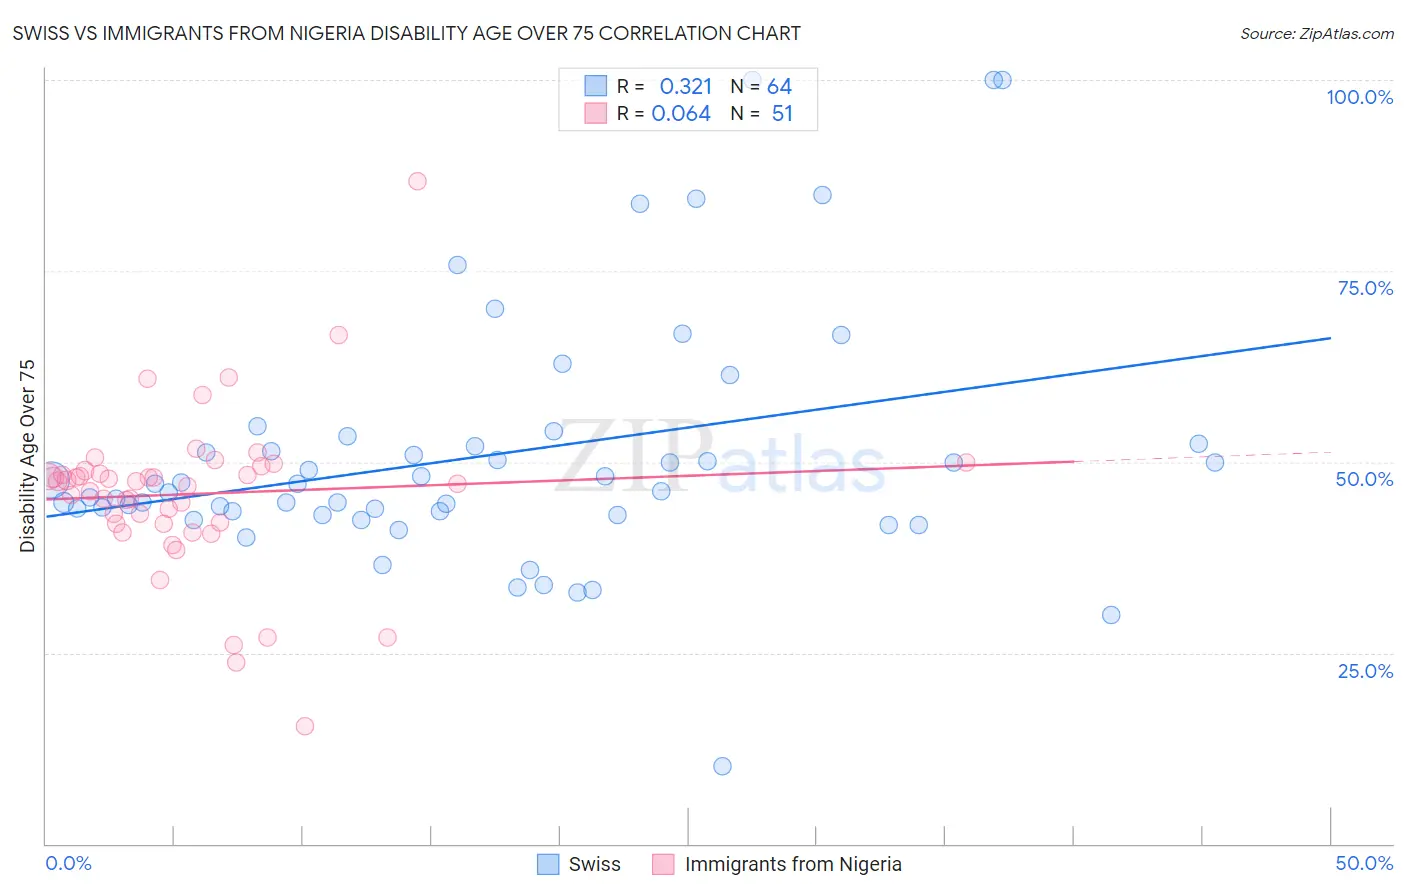
Swiss vs Immigrants from Nigeria Disability Age Over 75 Correlation Chart

The statistical analysis conducted on geographies consisting of 464,270,754 people shows a mild positive correlation between the proportion of Swiss and percentage of population with a disability over the age of 75 in the United States with a correlation coefficient (R) of 0.321 and weighted average of 46.2%. Similarly, the statistical analysis conducted on geographies consisting of 283,030,809 people shows a slight positive correlation between the proportion of Immigrants from Nigeria and percentage of population with a disability over the age of 75 in the United States with a correlation coefficient (R) of 0.064 and weighted average of 47.5%, a difference of 2.9%.
Swiss vs Immigrants from Nigeria Disability Age Over 75

Disability Age Over 75 Correlation Summary

MeasurementSwissImmigrants from Nigeria
Minimum10.2%15.5%
Maximum100.0%86.8%
Range89.8%71.3%
Mean50.9%45.8%
Median46.6%47.5%
Interquartile 25% (IQ1)43.3%42.0%
Interquartile 75% (IQ3)52.2%48.9%
Interquartile Range (IQR)8.9%6.9%
Standard Deviation (Sample)16.7%10.8%
Standard Deviation (Population)16.5%10.7%

Similar Demographics by Disability Age Over 75

Demographics Similar to Swiss by Disability Age Over 75

In terms of disability age over 75, the demographic groups most similar to Swiss are Soviet Union (46.2%, a difference of 0.0%), New Zealander (46.2%, a difference of 0.010%), Immigrants from Latvia (46.2%, a difference of 0.030%), Argentinean (46.2%, a difference of 0.030%), and Immigrants from Western Europe (46.2%, a difference of 0.040%).
DemographicsRating | RankDisability Age Over 75
Immigrants | Hungary
99.1
/100
|
#72
Exceptional
46.1%
Cambodians
99.1
/100
|
#73
Exceptional
46.1%
Egyptians
99.0
/100
|
#74
Exceptional
46.1%
Serbians
99.0
/100
|
#75
Exceptional
46.1%
Slavs
98.9
/100
|
#76
Exceptional
46.1%
Immigrants | Eastern Asia
98.9
/100
|
#77
Exceptional
46.2%
Immigrants | Western Europe
98.8
/100
|
#78
Exceptional
46.2%
Swiss
98.8
/100
|
#79
Exceptional
46.2%
Soviet Union
98.8
/100
|
#80
Exceptional
46.2%
New Zealanders
98.8
/100
|
#81
Exceptional
46.2%
Immigrants | Latvia
98.7
/100
|
#82
Exceptional
46.2%
Argentineans
98.7
/100
|
#83
Exceptional
46.2%
Immigrants | Jordan
98.7
/100
|
#84
Exceptional
46.2%
Immigrants | Southern Europe
98.6
/100
|
#85
Exceptional
46.2%
Romanians
98.6
/100
|
#86
Exceptional
46.2%

Demographics Similar to Immigrants from Nigeria by Disability Age Over 75

In terms of disability age over 75, the demographic groups most similar to Immigrants from Nigeria are Ghanaian (47.5%, a difference of 0.030%), Sudanese (47.5%, a difference of 0.050%), Immigrants from Sudan (47.5%, a difference of 0.060%), Basque (47.6%, a difference of 0.080%), and Immigrants from Kenya (47.6%, a difference of 0.080%).
DemographicsRating | RankDisability Age Over 75
Haitians
44.6
/100
|
#177
Average
47.4%
Cubans
42.1
/100
|
#178
Average
47.4%
Sierra Leoneans
41.7
/100
|
#179
Average
47.4%
Immigrants | Ecuador
41.7
/100
|
#180
Average
47.4%
Immigrants | Kazakhstan
40.4
/100
|
#181
Average
47.4%
Immigrants | Moldova
39.9
/100
|
#182
Fair
47.4%
Delaware
39.1
/100
|
#183
Fair
47.5%
Immigrants | Nigeria
34.0
/100
|
#184
Fair
47.5%
Ghanaians
33.0
/100
|
#185
Fair
47.5%
Sudanese
32.0
/100
|
#186
Fair
47.5%
Immigrants | Sudan
31.8
/100
|
#187
Fair
47.5%
Basques
30.9
/100
|
#188
Fair
47.6%
Immigrants | Kenya
30.8
/100
|
#189
Fair
47.6%
Somalis
29.5
/100
|
#190
Fair
47.6%
Portuguese
29.3
/100
|
#191
Fair
47.6%