Immigrants from Nigeria vs Welsh Female Disability
COMPARE
Immigrants from Nigeria
Welsh
Female Disability
Female Disability Comparison
Immigrants from Nigeria
Welsh
11.8%
FEMALE DISABILITY
97.2/ 100
METRIC RATING
118th/ 347
METRIC RANK
13.1%
FEMALE DISABILITY
0.0/ 100
METRIC RATING
282nd/ 347
METRIC RANK
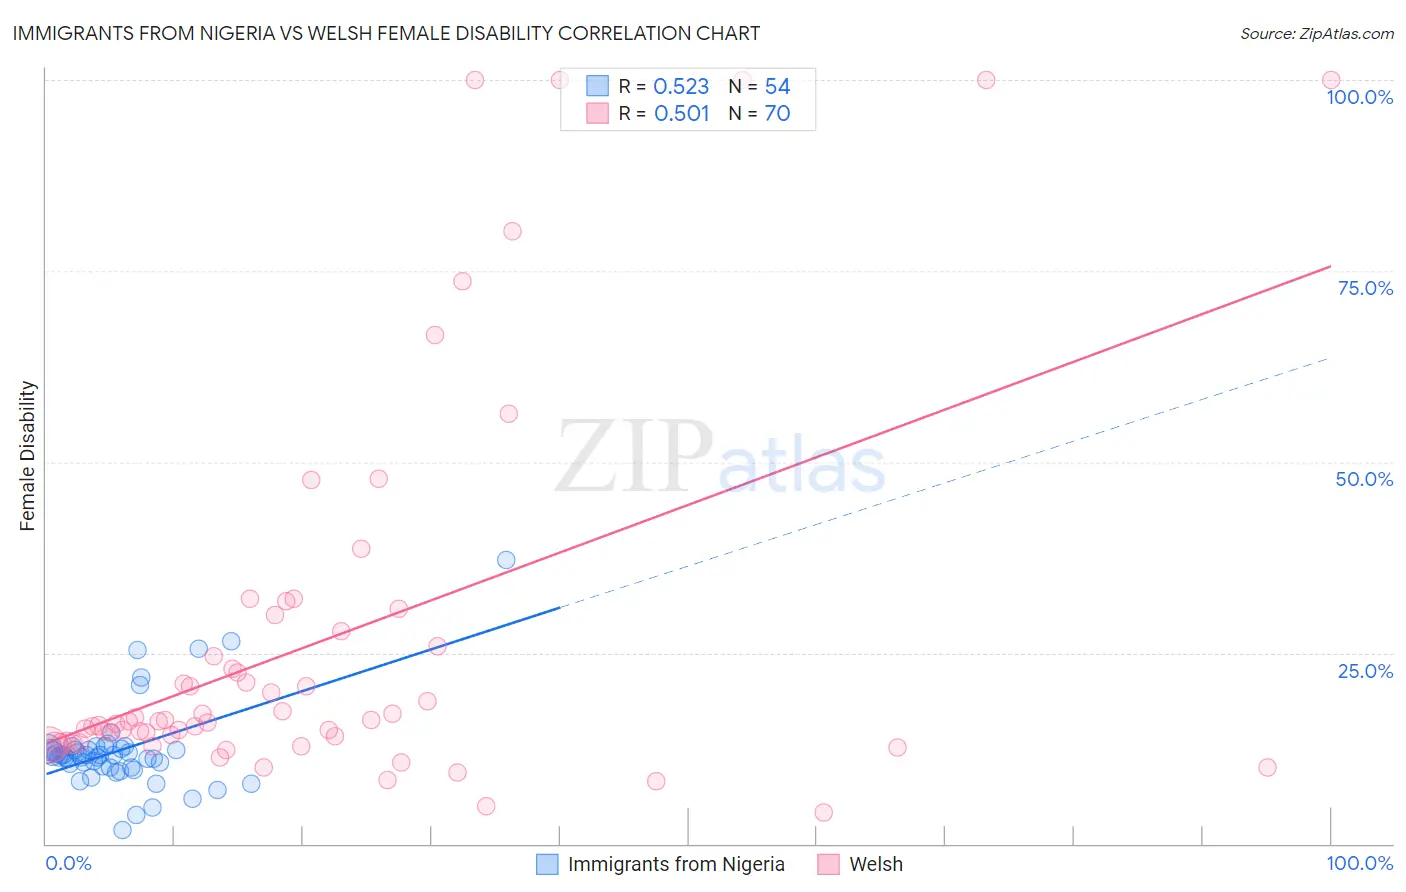
Immigrants from Nigeria vs Welsh Female Disability Correlation Chart
The statistical analysis conducted on geographies consisting of 283,471,855 people shows a substantial positive correlation between the proportion of Immigrants from Nigeria and percentage of females with a disability in the United States with a correlation coefficient (R) of 0.523 and weighted average of 11.8%. Similarly, the statistical analysis conducted on geographies consisting of 528,453,595 people shows a substantial positive correlation between the proportion of Welsh and percentage of females with a disability in the United States with a correlation coefficient (R) of 0.501 and weighted average of 13.1%, a difference of 10.9%.
Female Disability Correlation Summary
| Measurement | Immigrants from Nigeria | Welsh |
| Minimum | 1.7% | 4.2% |
| Maximum | 37.1% | 100.0% |
| Range | 35.4% | 95.8% |
| Mean | 12.3% | 26.8% |
| Median | 11.5% | 16.1% |
| Interquartile 25% (IQ1) | 10.1% | 13.2% |
| Interquartile 75% (IQ3) | 12.4% | 27.8% |
| Interquartile Range (IQR) | 2.3% | 14.7% |
| Standard Deviation (Sample) | 5.8% | 25.2% |
| Standard Deviation (Population) | 5.7% | 25.0% |
Similar Demographics by Female Disability
Demographics Similar to Immigrants from Nigeria by Female Disability
In terms of female disability, the demographic groups most similar to Immigrants from Nigeria are Immigrants from Eastern Europe (11.8%, a difference of 0.0%), Immigrants from Uganda (11.8%, a difference of 0.010%), Immigrants from Kazakhstan (11.8%, a difference of 0.090%), Immigrants from Netherlands (11.8%, a difference of 0.11%), and Immigrants from North Macedonia (11.8%, a difference of 0.12%).
| Demographics | Rating | Rank | Female Disability |
| Costa Ricans | 98.1 /100 | #111 | Exceptional 11.7% |
| Immigrants | Bangladesh | 97.8 /100 | #112 | Exceptional 11.8% |
| Immigrants | Belarus | 97.8 /100 | #113 | Exceptional 11.8% |
| South Africans | 97.7 /100 | #114 | Exceptional 11.8% |
| Brazilians | 97.7 /100 | #115 | Exceptional 11.8% |
| Immigrants | Morocco | 97.6 /100 | #116 | Exceptional 11.8% |
| Immigrants | Eastern Europe | 97.2 /100 | #117 | Exceptional 11.8% |
| Immigrants | Nigeria | 97.2 /100 | #118 | Exceptional 11.8% |
| Immigrants | Uganda | 97.2 /100 | #119 | Exceptional 11.8% |
| Immigrants | Kazakhstan | 97.0 /100 | #120 | Exceptional 11.8% |
| Immigrants | Netherlands | 96.9 /100 | #121 | Exceptional 11.8% |
| Immigrants | North Macedonia | 96.8 /100 | #122 | Exceptional 11.8% |
| Immigrants | Croatia | 96.7 /100 | #123 | Exceptional 11.8% |
| Russians | 96.5 /100 | #124 | Exceptional 11.8% |
| Immigrants | Italy | 96.4 /100 | #125 | Exceptional 11.8% |
Demographics Similar to Welsh by Female Disability
In terms of female disability, the demographic groups most similar to Welsh are English (13.1%, a difference of 0.0%), U.S. Virgin Islander (13.1%, a difference of 0.080%), Irish (13.1%, a difference of 0.11%), Hmong (13.1%, a difference of 0.14%), and Bangladeshi (13.1%, a difference of 0.19%).
| Demographics | Rating | Rank | Female Disability |
| Cheyenne | 0.1 /100 | #275 | Tragic 13.0% |
| Immigrants | Dominica | 0.1 /100 | #276 | Tragic 13.0% |
| Spanish | 0.1 /100 | #277 | Tragic 13.0% |
| Scottish | 0.1 /100 | #278 | Tragic 13.0% |
| Arapaho | 0.1 /100 | #279 | Tragic 13.0% |
| Irish | 0.1 /100 | #280 | Tragic 13.1% |
| U.S. Virgin Islanders | 0.1 /100 | #281 | Tragic 13.1% |
| Welsh | 0.0 /100 | #282 | Tragic 13.1% |
| English | 0.0 /100 | #283 | Tragic 13.1% |
| Hmong | 0.0 /100 | #284 | Tragic 13.1% |
| Bangladeshis | 0.0 /100 | #285 | Tragic 13.1% |
| Fijians | 0.0 /100 | #286 | Tragic 13.1% |
| Yaqui | 0.0 /100 | #287 | Tragic 13.2% |
| Whites/Caucasians | 0.0 /100 | #288 | Tragic 13.2% |
| Tlingit-Haida | 0.0 /100 | #289 | Tragic 13.2% |