Spanish vs Immigrants from Latin America Disability Age 35 to 64
COMPARE
Spanish
Immigrants from Latin America
Disability Age 35 to 64
Disability Age 35 to 64 Comparison
Spanish
Immigrants from Latin America
12.7%
DISABILITY AGE 35 TO 64
0.2/ 100
METRIC RATING
269th/ 347
METRIC RANK
11.5%
DISABILITY AGE 35 TO 64
27.5/ 100
METRIC RATING
194th/ 347
METRIC RANK
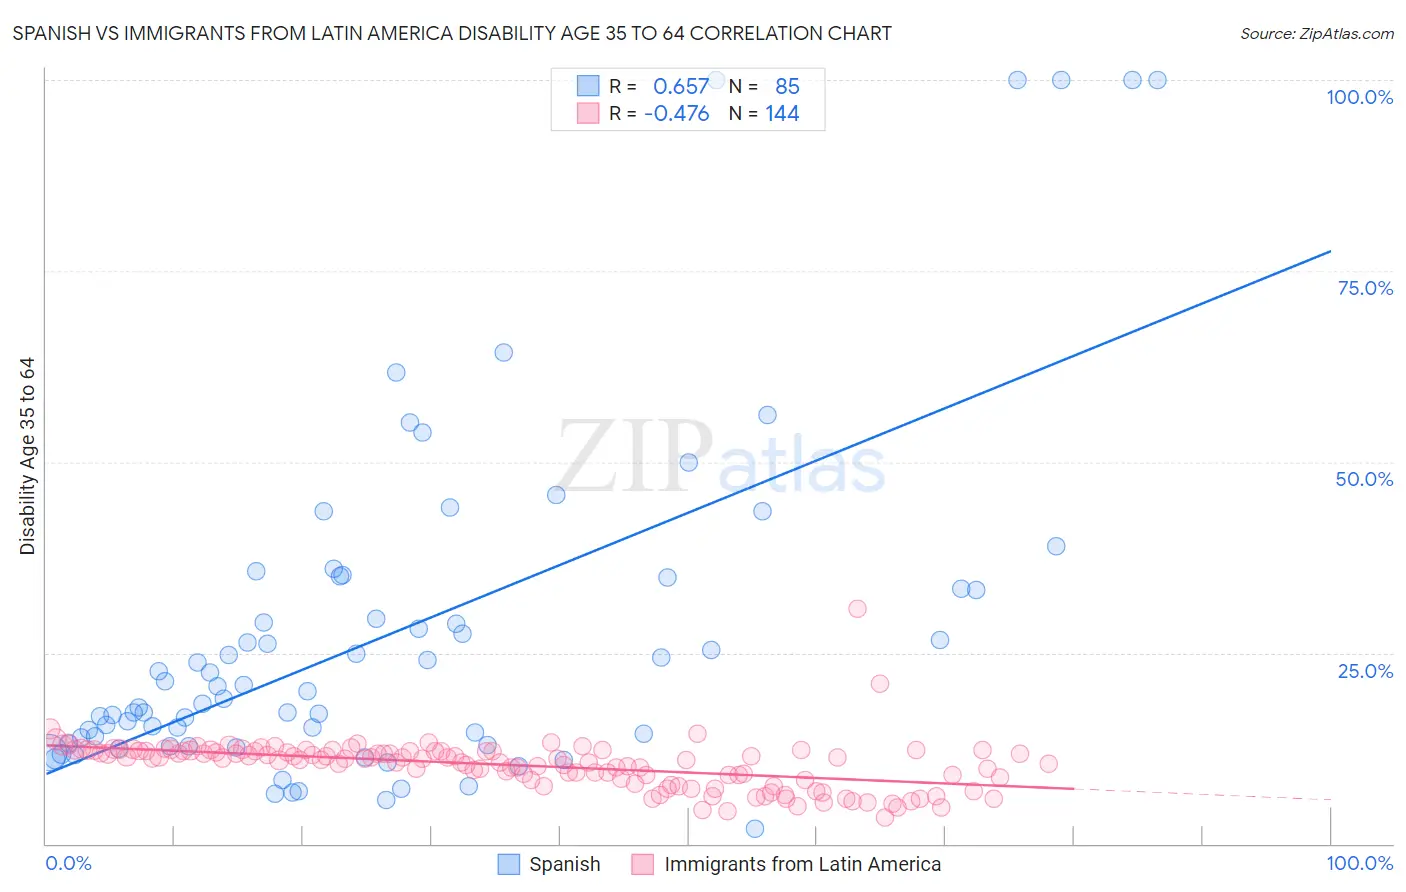
Spanish vs Immigrants from Latin America Disability Age 35 to 64 Correlation Chart
The statistical analysis conducted on geographies consisting of 421,846,574 people shows a significant positive correlation between the proportion of Spanish and percentage of population with a disability between the ages 34 and 64 in the United States with a correlation coefficient (R) of 0.657 and weighted average of 12.7%. Similarly, the statistical analysis conducted on geographies consisting of 557,697,634 people shows a moderate negative correlation between the proportion of Immigrants from Latin America and percentage of population with a disability between the ages 34 and 64 in the United States with a correlation coefficient (R) of -0.476 and weighted average of 11.5%, a difference of 10.3%.
Disability Age 35 to 64 Correlation Summary
| Measurement | Spanish | Immigrants from Latin America |
| Minimum | 2.0% | 3.5% |
| Maximum | 100.0% | 30.7% |
| Range | 98.0% | 27.2% |
| Mean | 27.5% | 10.3% |
| Median | 19.9% | 11.1% |
| Interquartile 25% (IQ1) | 13.1% | 8.4% |
| Interquartile 75% (IQ3) | 34.1% | 12.2% |
| Interquartile Range (IQR) | 21.1% | 3.7% |
| Standard Deviation (Sample) | 22.7% | 3.2% |
| Standard Deviation (Population) | 22.5% | 3.2% |
Similar Demographics by Disability Age 35 to 64
Demographics Similar to Spanish by Disability Age 35 to 64
In terms of disability age 35 to 64, the demographic groups most similar to Spanish are French (12.7%, a difference of 0.040%), Immigrants from Dominica (12.7%, a difference of 0.10%), Subsaharan African (12.6%, a difference of 0.28%), White/Caucasian (12.6%, a difference of 0.44%), and Nepalese (12.8%, a difference of 1.1%).
| Demographics | Rating | Rank | Disability Age 35 to 64 |
| Senegalese | 0.5 /100 | #262 | Tragic 12.5% |
| Immigrants | Zaire | 0.4 /100 | #263 | Tragic 12.5% |
| Immigrants | Portugal | 0.4 /100 | #264 | Tragic 12.5% |
| Marshallese | 0.4 /100 | #265 | Tragic 12.5% |
| Whites/Caucasians | 0.3 /100 | #266 | Tragic 12.6% |
| Sub-Saharan Africans | 0.2 /100 | #267 | Tragic 12.6% |
| Immigrants | Dominica | 0.2 /100 | #268 | Tragic 12.7% |
| Spanish | 0.2 /100 | #269 | Tragic 12.7% |
| French | 0.2 /100 | #270 | Tragic 12.7% |
| Nepalese | 0.1 /100 | #271 | Tragic 12.8% |
| U.S. Virgin Islanders | 0.1 /100 | #272 | Tragic 12.8% |
| Pennsylvania Germans | 0.1 /100 | #273 | Tragic 12.8% |
| Celtics | 0.1 /100 | #274 | Tragic 12.9% |
| Dominicans | 0.1 /100 | #275 | Tragic 12.9% |
| Somalis | 0.1 /100 | #276 | Tragic 12.9% |
Demographics Similar to Immigrants from Latin America by Disability Age 35 to 64
In terms of disability age 35 to 64, the demographic groups most similar to Immigrants from Latin America are Immigrants from Africa (11.5%, a difference of 0.15%), Norwegian (11.5%, a difference of 0.21%), Carpatho Rusyn (11.5%, a difference of 0.22%), Iraqi (11.5%, a difference of 0.34%), and Swedish (11.4%, a difference of 0.37%).
| Demographics | Rating | Rank | Disability Age 35 to 64 |
| Immigrants | Bosnia and Herzegovina | 35.2 /100 | #187 | Fair 11.4% |
| Northern Europeans | 34.9 /100 | #188 | Fair 11.4% |
| Hungarians | 34.6 /100 | #189 | Fair 11.4% |
| Immigrants | Nigeria | 32.5 /100 | #190 | Fair 11.4% |
| Swedes | 31.3 /100 | #191 | Fair 11.4% |
| Norwegians | 29.7 /100 | #192 | Fair 11.5% |
| Immigrants | Africa | 29.0 /100 | #193 | Fair 11.5% |
| Immigrants | Latin America | 27.5 /100 | #194 | Fair 11.5% |
| Carpatho Rusyns | 25.3 /100 | #195 | Fair 11.5% |
| Iraqis | 24.2 /100 | #196 | Fair 11.5% |
| Immigrants | Iraq | 21.0 /100 | #197 | Fair 11.6% |
| Immigrants | Panama | 20.4 /100 | #198 | Fair 11.6% |
| Basques | 19.5 /100 | #199 | Poor 11.6% |
| Swiss | 18.7 /100 | #200 | Poor 11.6% |
| Immigrants | Kenya | 17.7 /100 | #201 | Poor 11.6% |