Spanish American vs Soviet Union Householder Income Under 25 years
COMPARE
Spanish American
Soviet Union
Householder Income Under 25 years
Householder Income Under 25 years Comparison
Spanish Americans
Soviet Union
$46,913
HOUSEHOLDER INCOME UNDER 25 YEARS
0.0/ 100
METRIC RATING
318th/ 347
METRIC RANK
$55,340
HOUSEHOLDER INCOME UNDER 25 YEARS
100.0/ 100
METRIC RATING
57th/ 347
METRIC RANK
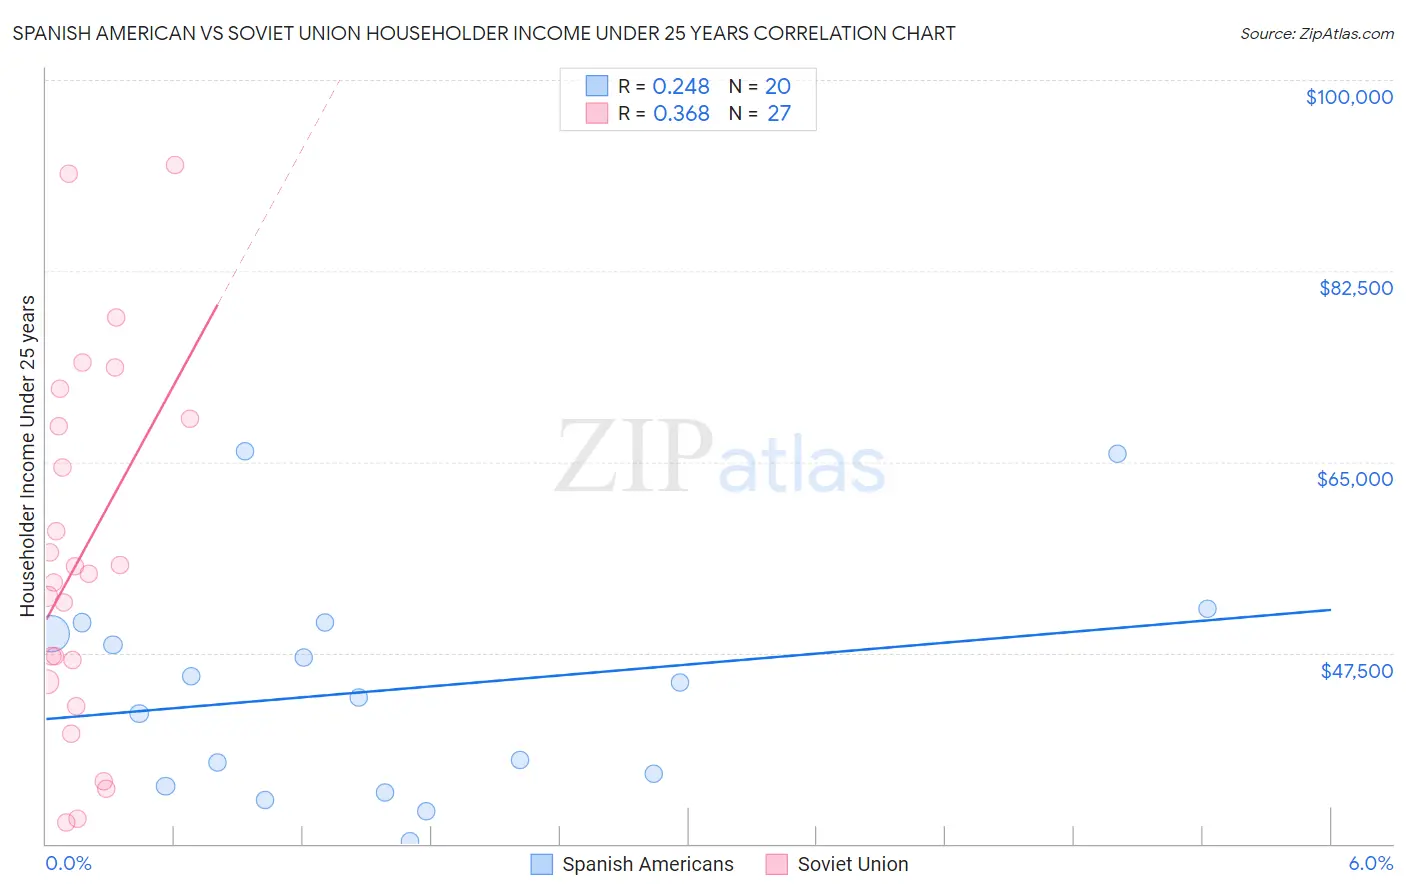
Spanish American vs Soviet Union Householder Income Under 25 years Correlation Chart
The statistical analysis conducted on geographies consisting of 97,599,501 people shows a weak positive correlation between the proportion of Spanish Americans and household income with householder under the age of 25 in the United States with a correlation coefficient (R) of 0.248 and weighted average of $46,913. Similarly, the statistical analysis conducted on geographies consisting of 41,172,348 people shows a mild positive correlation between the proportion of Soviet Union and household income with householder under the age of 25 in the United States with a correlation coefficient (R) of 0.368 and weighted average of $55,340, a difference of 18.0%.
Householder Income Under 25 years Correlation Summary
| Measurement | Spanish American | Soviet Union |
| Minimum | $30,224 | $31,928 |
| Maximum | $65,953 | $92,155 |
| Range | $35,729 | $60,227 |
| Mean | $44,130 | $56,535 |
| Median | $44,094 | $54,732 |
| Interquartile 25% (IQ1) | $35,845 | $44,839 |
| Interquartile 75% (IQ3) | $49,764 | $69,000 |
| Interquartile Range (IQR) | $13,919 | $24,161 |
| Standard Deviation (Sample) | $9,911 | $16,589 |
| Standard Deviation (Population) | $9,660 | $16,279 |
Similar Demographics by Householder Income Under 25 years
Demographics Similar to Spanish Americans by Householder Income Under 25 years
In terms of householder income under 25 years, the demographic groups most similar to Spanish Americans are Hopi ($46,978, a difference of 0.14%), Sudanese ($46,982, a difference of 0.15%), African ($46,838, a difference of 0.16%), Crow ($47,012, a difference of 0.21%), and Chippewa ($47,015, a difference of 0.22%).
| Demographics | Rating | Rank | Householder Income Under 25 years |
| Ottawa | 0.0 /100 | #311 | Tragic $47,366 |
| Bermudans | 0.0 /100 | #312 | Tragic $47,359 |
| Delaware | 0.0 /100 | #313 | Tragic $47,159 |
| Chippewa | 0.0 /100 | #314 | Tragic $47,015 |
| Crow | 0.0 /100 | #315 | Tragic $47,012 |
| Sudanese | 0.0 /100 | #316 | Tragic $46,982 |
| Hopi | 0.0 /100 | #317 | Tragic $46,978 |
| Spanish Americans | 0.0 /100 | #318 | Tragic $46,913 |
| Africans | 0.0 /100 | #319 | Tragic $46,838 |
| Immigrants | Sudan | 0.0 /100 | #320 | Tragic $46,791 |
| Potawatomi | 0.0 /100 | #321 | Tragic $46,462 |
| Sioux | 0.0 /100 | #322 | Tragic $46,417 |
| Immigrants | Saudi Arabia | 0.0 /100 | #323 | Tragic $46,187 |
| Dutch West Indians | 0.0 /100 | #324 | Tragic $45,816 |
| Immigrants | Bahamas | 0.0 /100 | #325 | Tragic $45,793 |
Demographics Similar to Soviet Union by Householder Income Under 25 years
In terms of householder income under 25 years, the demographic groups most similar to Soviet Union are Salvadoran ($55,412, a difference of 0.13%), Immigrants from Ukraine ($55,447, a difference of 0.19%), Immigrants from Poland ($55,474, a difference of 0.24%), Sri Lankan ($55,470, a difference of 0.24%), and Guyanese ($55,210, a difference of 0.24%).
| Demographics | Rating | Rank | Householder Income Under 25 years |
| Puget Sound Salish | 100.0 /100 | #50 | Exceptional $55,543 |
| Immigrants | Romania | 100.0 /100 | #51 | Exceptional $55,522 |
| Immigrants | Indonesia | 100.0 /100 | #52 | Exceptional $55,521 |
| Immigrants | Poland | 100.0 /100 | #53 | Exceptional $55,474 |
| Sri Lankans | 100.0 /100 | #54 | Exceptional $55,470 |
| Immigrants | Ukraine | 100.0 /100 | #55 | Exceptional $55,447 |
| Salvadorans | 100.0 /100 | #56 | Exceptional $55,412 |
| Soviet Union | 100.0 /100 | #57 | Exceptional $55,340 |
| Guyanese | 99.9 /100 | #58 | Exceptional $55,210 |
| Native Hawaiians | 99.9 /100 | #59 | Exceptional $55,158 |
| Immigrants | Lithuania | 99.9 /100 | #60 | Exceptional $55,028 |
| Immigrants | Europe | 99.9 /100 | #61 | Exceptional $55,022 |
| Immigrants | Uzbekistan | 99.8 /100 | #62 | Exceptional $54,846 |
| Immigrants | Belgium | 99.8 /100 | #63 | Exceptional $54,830 |
| Burmese | 99.8 /100 | #64 | Exceptional $54,800 |