Portuguese vs Immigrants from Taiwan Hearing Disability
COMPARE
Portuguese
Immigrants from Taiwan
Hearing Disability
Hearing Disability Comparison
Portuguese
Immigrants from Taiwan
3.5%
HEARING DISABILITY
0.1/ 100
METRIC RATING
260th/ 347
METRIC RANK
2.6%
HEARING DISABILITY
99.4/ 100
METRIC RATING
41st/ 347
METRIC RANK
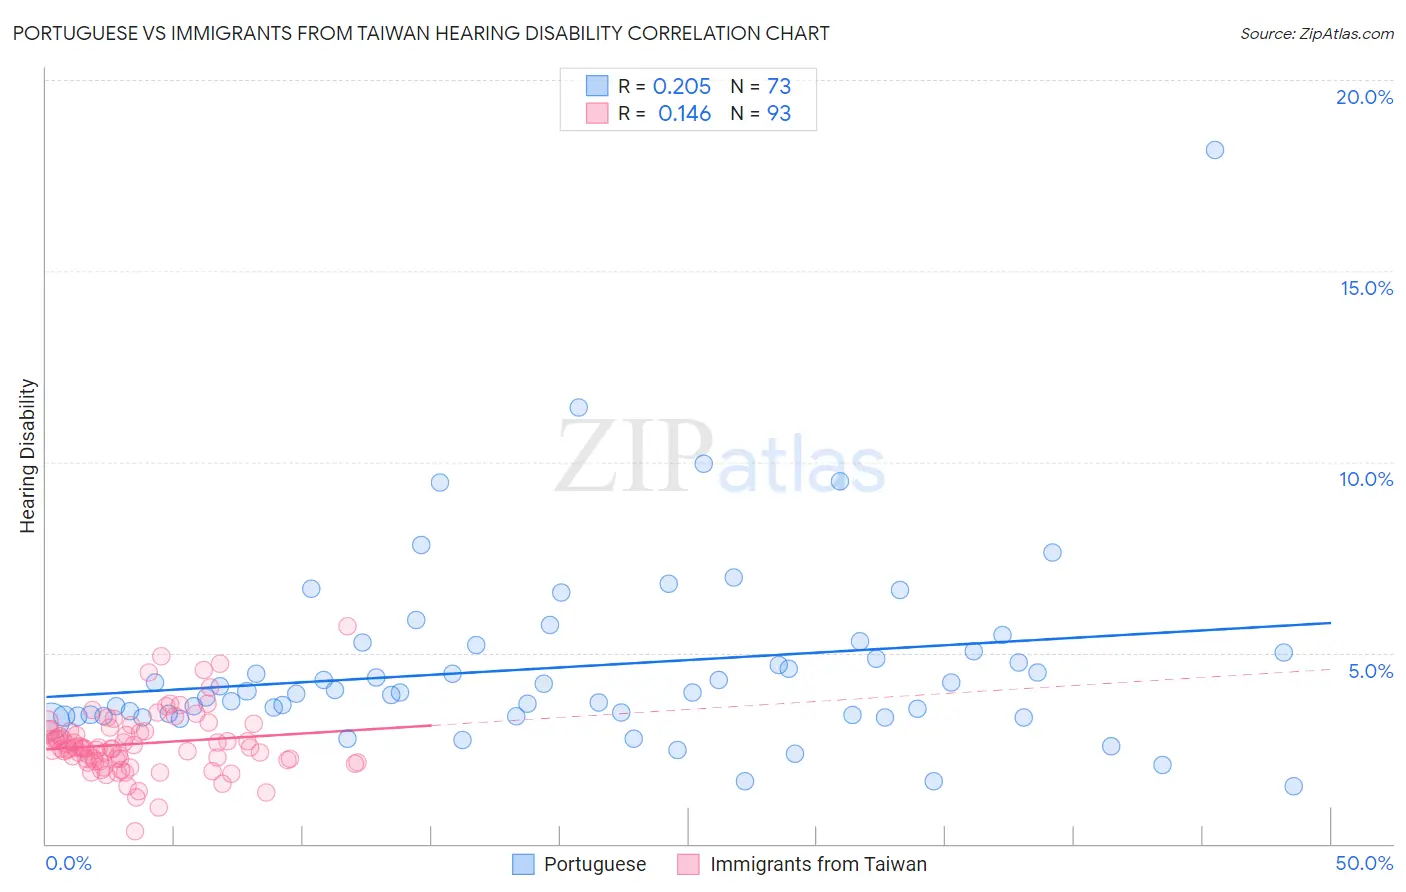
Portuguese vs Immigrants from Taiwan Hearing Disability Correlation Chart
The statistical analysis conducted on geographies consisting of 450,060,128 people shows a weak positive correlation between the proportion of Portuguese and percentage of population with hearing disability in the United States with a correlation coefficient (R) of 0.205 and weighted average of 3.5%. Similarly, the statistical analysis conducted on geographies consisting of 298,207,747 people shows a poor positive correlation between the proportion of Immigrants from Taiwan and percentage of population with hearing disability in the United States with a correlation coefficient (R) of 0.146 and weighted average of 2.6%, a difference of 31.3%.
Hearing Disability Correlation Summary
| Measurement | Portuguese | Immigrants from Taiwan |
| Minimum | 1.5% | 0.31% |
| Maximum | 18.2% | 5.7% |
| Range | 16.7% | 5.4% |
| Mean | 4.6% | 2.6% |
| Median | 3.9% | 2.5% |
| Interquartile 25% (IQ1) | 3.4% | 2.2% |
| Interquartile 75% (IQ3) | 5.1% | 3.0% |
| Interquartile Range (IQR) | 1.8% | 0.78% |
| Standard Deviation (Sample) | 2.5% | 0.82% |
| Standard Deviation (Population) | 2.5% | 0.82% |
Similar Demographics by Hearing Disability
Demographics Similar to Portuguese by Hearing Disability
In terms of hearing disability, the demographic groups most similar to Portuguese are Hawaiian (3.5%, a difference of 0.040%), Slovene (3.5%, a difference of 0.080%), Immigrants from North America (3.5%, a difference of 0.15%), Immigrants from Canada (3.5%, a difference of 0.19%), and Northern European (3.4%, a difference of 0.32%).
| Demographics | Rating | Rank | Hearing Disability |
| Carpatho Rusyns | 0.3 /100 | #253 | Tragic 3.4% |
| Slavs | 0.2 /100 | #254 | Tragic 3.4% |
| Poles | 0.2 /100 | #255 | Tragic 3.4% |
| Hmong | 0.2 /100 | #256 | Tragic 3.4% |
| Yaqui | 0.2 /100 | #257 | Tragic 3.4% |
| Northern Europeans | 0.2 /100 | #258 | Tragic 3.4% |
| Slovenes | 0.1 /100 | #259 | Tragic 3.5% |
| Portuguese | 0.1 /100 | #260 | Tragic 3.5% |
| Hawaiians | 0.1 /100 | #261 | Tragic 3.5% |
| Immigrants | North America | 0.1 /100 | #262 | Tragic 3.5% |
| Immigrants | Canada | 0.1 /100 | #263 | Tragic 3.5% |
| Immigrants | Germany | 0.1 /100 | #264 | Tragic 3.5% |
| British | 0.1 /100 | #265 | Tragic 3.5% |
| Belgians | 0.1 /100 | #266 | Tragic 3.5% |
| Canadians | 0.1 /100 | #267 | Tragic 3.5% |
Demographics Similar to Immigrants from Taiwan by Hearing Disability
In terms of hearing disability, the demographic groups most similar to Immigrants from Taiwan are West Indian (2.6%, a difference of 0.010%), Senegalese (2.6%, a difference of 0.010%), Nigerian (2.6%, a difference of 0.23%), Venezuelan (2.6%, a difference of 0.26%), and Haitian (2.6%, a difference of 0.34%).
| Demographics | Rating | Rank | Hearing Disability |
| Immigrants | Pakistan | 99.6 /100 | #34 | Exceptional 2.6% |
| Salvadorans | 99.6 /100 | #35 | Exceptional 2.6% |
| Okinawans | 99.6 /100 | #36 | Exceptional 2.6% |
| Immigrants | Western Africa | 99.6 /100 | #37 | Exceptional 2.6% |
| Immigrants | Jamaica | 99.5 /100 | #38 | Exceptional 2.6% |
| Immigrants | China | 99.5 /100 | #39 | Exceptional 2.6% |
| Haitians | 99.5 /100 | #40 | Exceptional 2.6% |
| Immigrants | Taiwan | 99.4 /100 | #41 | Exceptional 2.6% |
| West Indians | 99.4 /100 | #42 | Exceptional 2.6% |
| Senegalese | 99.4 /100 | #43 | Exceptional 2.6% |
| Nigerians | 99.4 /100 | #44 | Exceptional 2.6% |
| Venezuelans | 99.4 /100 | #45 | Exceptional 2.6% |
| Immigrants | Dominica | 99.3 /100 | #46 | Exceptional 2.6% |
| Immigrants | Israel | 99.3 /100 | #47 | Exceptional 2.6% |
| Immigrants | Singapore | 99.3 /100 | #48 | Exceptional 2.6% |