Spanish American vs Belgian Female Disability
COMPARE
Spanish American
Belgian
Female Disability
Female Disability Comparison
Spanish Americans
Belgians
14.0%
FEMALE DISABILITY
0.0/ 100
METRIC RATING
316th/ 347
METRIC RANK
12.5%
FEMALE DISABILITY
6.5/ 100
METRIC RATING
231st/ 347
METRIC RANK
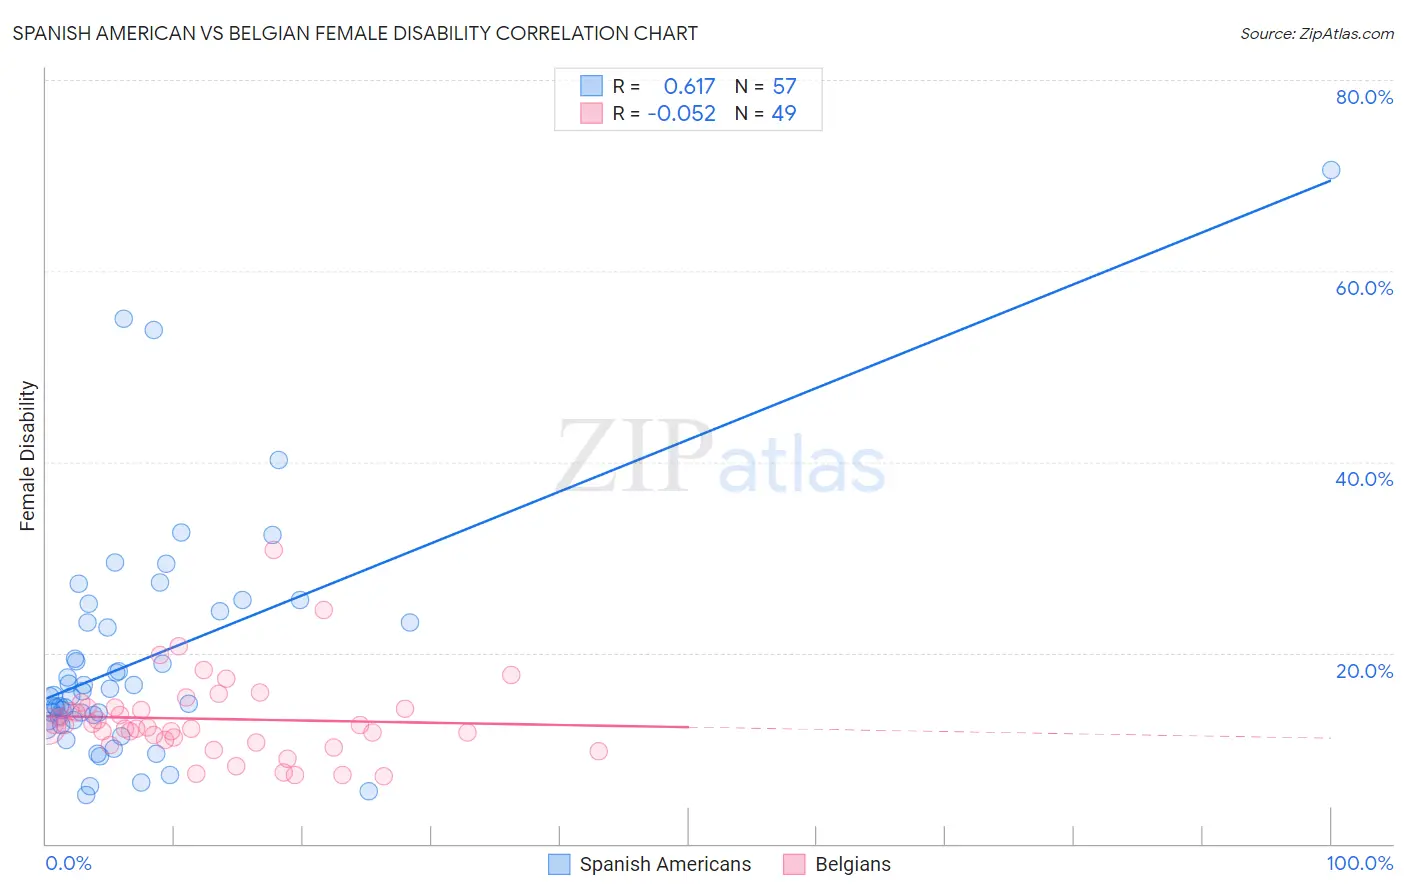
Spanish American vs Belgian Female Disability Correlation Chart
The statistical analysis conducted on geographies consisting of 103,163,564 people shows a significant positive correlation between the proportion of Spanish Americans and percentage of females with a disability in the United States with a correlation coefficient (R) of 0.617 and weighted average of 14.0%. Similarly, the statistical analysis conducted on geographies consisting of 355,987,027 people shows a slight negative correlation between the proportion of Belgians and percentage of females with a disability in the United States with a correlation coefficient (R) of -0.052 and weighted average of 12.5%, a difference of 11.8%.
Female Disability Correlation Summary
| Measurement | Spanish American | Belgian |
| Minimum | 5.1% | 7.1% |
| Maximum | 70.6% | 30.7% |
| Range | 65.5% | 23.6% |
| Mean | 19.3% | 13.1% |
| Median | 15.6% | 12.3% |
| Interquartile 25% (IQ1) | 12.9% | 10.8% |
| Interquartile 75% (IQ3) | 23.8% | 14.3% |
| Interquartile Range (IQR) | 10.8% | 3.5% |
| Standard Deviation (Sample) | 12.2% | 4.4% |
| Standard Deviation (Population) | 12.1% | 4.3% |
Similar Demographics by Female Disability
Demographics Similar to Spanish Americans by Female Disability
In terms of female disability, the demographic groups most similar to Spanish Americans are Chippewa (14.0%, a difference of 0.11%), Paiute (14.0%, a difference of 0.22%), Alaskan Athabascan (13.9%, a difference of 0.36%), Iroquois (14.0%, a difference of 0.50%), and American (14.1%, a difference of 0.85%).
| Demographics | Rating | Rank | Female Disability |
| French American Indians | 0.0 /100 | #309 | Tragic 13.7% |
| Apache | 0.0 /100 | #310 | Tragic 13.7% |
| Hopi | 0.0 /100 | #311 | Tragic 13.7% |
| Delaware | 0.0 /100 | #312 | Tragic 13.8% |
| Blackfeet | 0.0 /100 | #313 | Tragic 13.8% |
| Puget Sound Salish | 0.0 /100 | #314 | Tragic 13.8% |
| Alaskan Athabascans | 0.0 /100 | #315 | Tragic 13.9% |
| Spanish Americans | 0.0 /100 | #316 | Tragic 14.0% |
| Chippewa | 0.0 /100 | #317 | Tragic 14.0% |
| Paiute | 0.0 /100 | #318 | Tragic 14.0% |
| Iroquois | 0.0 /100 | #319 | Tragic 14.0% |
| Americans | 0.0 /100 | #320 | Tragic 14.1% |
| Potawatomi | 0.0 /100 | #321 | Tragic 14.1% |
| Pueblo | 0.0 /100 | #322 | Tragic 14.1% |
| Blacks/African Americans | 0.0 /100 | #323 | Tragic 14.1% |
Demographics Similar to Belgians by Female Disability
In terms of female disability, the demographic groups most similar to Belgians are Immigrants from Belize (12.5%, a difference of 0.070%), Immigrants from Somalia (12.5%, a difference of 0.090%), Hungarian (12.5%, a difference of 0.11%), Immigrants from Cambodia (12.5%, a difference of 0.18%), and Immigrants from Iraq (12.5%, a difference of 0.19%).
| Demographics | Rating | Rank | Female Disability |
| Belizeans | 9.3 /100 | #224 | Tragic 12.5% |
| Poles | 8.4 /100 | #225 | Tragic 12.5% |
| Hispanics or Latinos | 8.0 /100 | #226 | Tragic 12.5% |
| Assyrians/Chaldeans/Syriacs | 8.0 /100 | #227 | Tragic 12.5% |
| Immigrants | Cambodia | 7.8 /100 | #228 | Tragic 12.5% |
| Hungarians | 7.2 /100 | #229 | Tragic 12.5% |
| Immigrants | Belize | 7.0 /100 | #230 | Tragic 12.5% |
| Belgians | 6.5 /100 | #231 | Tragic 12.5% |
| Immigrants | Somalia | 5.9 /100 | #232 | Tragic 12.5% |
| Immigrants | Iraq | 5.3 /100 | #233 | Tragic 12.5% |
| Scandinavians | 5.3 /100 | #234 | Tragic 12.5% |
| Malaysians | 5.0 /100 | #235 | Tragic 12.5% |
| Immigrants | West Indies | 4.4 /100 | #236 | Tragic 12.6% |
| Slavs | 3.8 /100 | #237 | Tragic 12.6% |
| Yugoslavians | 3.7 /100 | #238 | Tragic 12.6% |