Spanish American vs Arapaho Female Disability
COMPARE
Spanish American
Arapaho
Female Disability
Female Disability Comparison
Spanish Americans
Arapaho
14.0%
FEMALE DISABILITY
0.0/ 100
METRIC RATING
316th/ 347
METRIC RANK
13.0%
FEMALE DISABILITY
0.1/ 100
METRIC RATING
279th/ 347
METRIC RANK
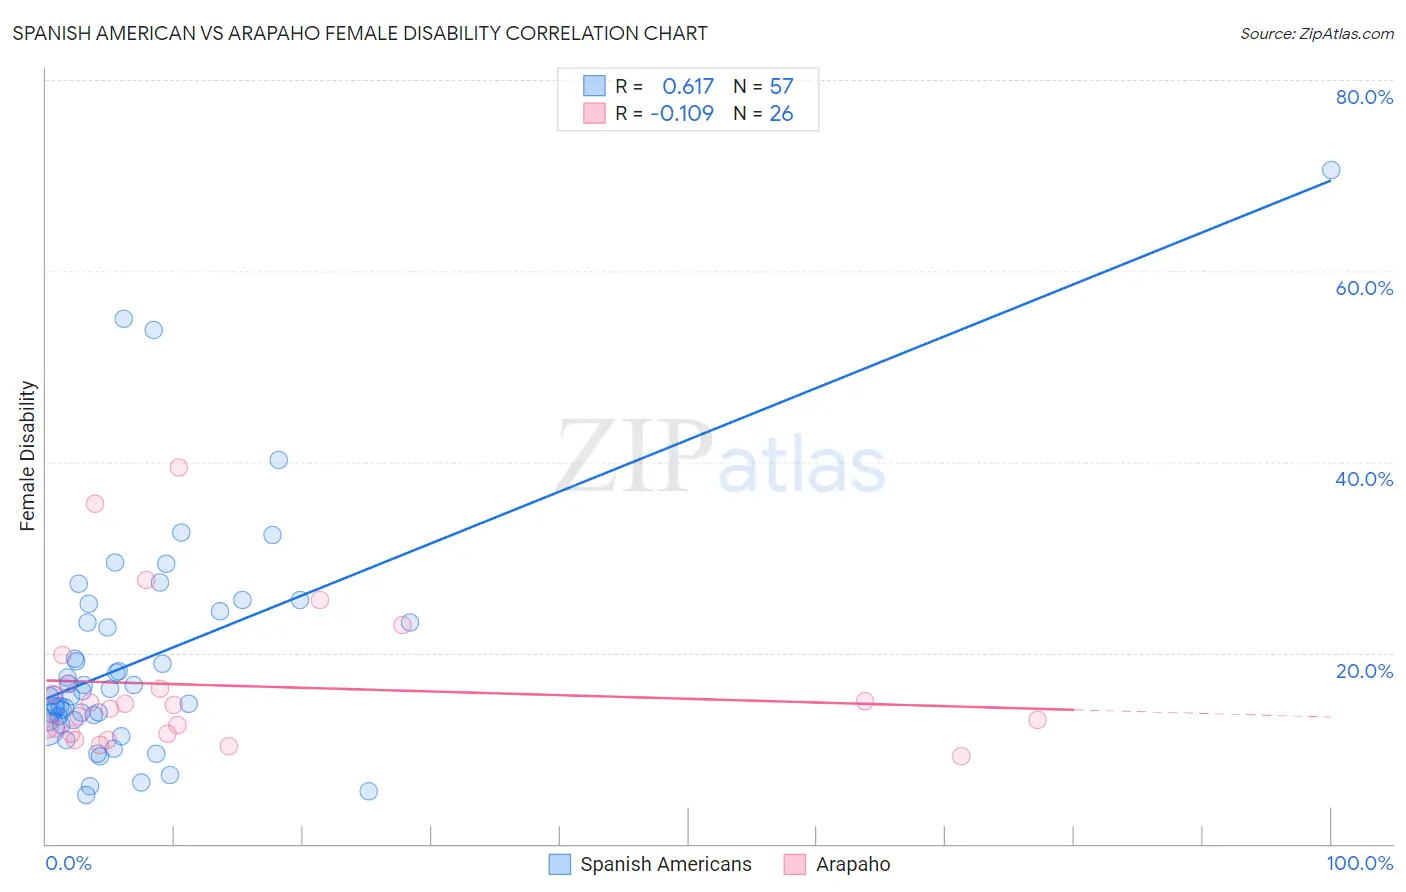
Spanish American vs Arapaho Female Disability Correlation Chart
The statistical analysis conducted on geographies consisting of 103,163,564 people shows a significant positive correlation between the proportion of Spanish Americans and percentage of females with a disability in the United States with a correlation coefficient (R) of 0.617 and weighted average of 14.0%. Similarly, the statistical analysis conducted on geographies consisting of 29,780,107 people shows a poor negative correlation between the proportion of Arapaho and percentage of females with a disability in the United States with a correlation coefficient (R) of -0.109 and weighted average of 13.0%, a difference of 7.1%.
Female Disability Correlation Summary
| Measurement | Spanish American | Arapaho |
| Minimum | 5.1% | 9.2% |
| Maximum | 70.6% | 39.4% |
| Range | 65.5% | 30.2% |
| Mean | 19.3% | 16.6% |
| Median | 15.6% | 14.3% |
| Interquartile 25% (IQ1) | 12.9% | 11.5% |
| Interquartile 75% (IQ3) | 23.8% | 16.8% |
| Interquartile Range (IQR) | 10.8% | 5.3% |
| Standard Deviation (Sample) | 12.2% | 7.7% |
| Standard Deviation (Population) | 12.1% | 7.6% |
Similar Demographics by Female Disability
Demographics Similar to Spanish Americans by Female Disability
In terms of female disability, the demographic groups most similar to Spanish Americans are Chippewa (14.0%, a difference of 0.11%), Paiute (14.0%, a difference of 0.22%), Alaskan Athabascan (13.9%, a difference of 0.36%), Iroquois (14.0%, a difference of 0.50%), and American (14.1%, a difference of 0.85%).
| Demographics | Rating | Rank | Female Disability |
| French American Indians | 0.0 /100 | #309 | Tragic 13.7% |
| Apache | 0.0 /100 | #310 | Tragic 13.7% |
| Hopi | 0.0 /100 | #311 | Tragic 13.7% |
| Delaware | 0.0 /100 | #312 | Tragic 13.8% |
| Blackfeet | 0.0 /100 | #313 | Tragic 13.8% |
| Puget Sound Salish | 0.0 /100 | #314 | Tragic 13.8% |
| Alaskan Athabascans | 0.0 /100 | #315 | Tragic 13.9% |
| Spanish Americans | 0.0 /100 | #316 | Tragic 14.0% |
| Chippewa | 0.0 /100 | #317 | Tragic 14.0% |
| Paiute | 0.0 /100 | #318 | Tragic 14.0% |
| Iroquois | 0.0 /100 | #319 | Tragic 14.0% |
| Americans | 0.0 /100 | #320 | Tragic 14.1% |
| Potawatomi | 0.0 /100 | #321 | Tragic 14.1% |
| Pueblo | 0.0 /100 | #322 | Tragic 14.1% |
| Blacks/African Americans | 0.0 /100 | #323 | Tragic 14.1% |
Demographics Similar to Arapaho by Female Disability
In terms of female disability, the demographic groups most similar to Arapaho are Irish (13.1%, a difference of 0.090%), U.S. Virgin Islander (13.1%, a difference of 0.12%), Welsh (13.1%, a difference of 0.20%), English (13.1%, a difference of 0.20%), and Scottish (13.0%, a difference of 0.24%).
| Demographics | Rating | Rank | Female Disability |
| Germans | 0.1 /100 | #272 | Tragic 12.9% |
| Sioux | 0.1 /100 | #273 | Tragic 12.9% |
| Portuguese | 0.1 /100 | #274 | Tragic 13.0% |
| Cheyenne | 0.1 /100 | #275 | Tragic 13.0% |
| Immigrants | Dominica | 0.1 /100 | #276 | Tragic 13.0% |
| Spanish | 0.1 /100 | #277 | Tragic 13.0% |
| Scottish | 0.1 /100 | #278 | Tragic 13.0% |
| Arapaho | 0.1 /100 | #279 | Tragic 13.0% |
| Irish | 0.1 /100 | #280 | Tragic 13.1% |
| U.S. Virgin Islanders | 0.1 /100 | #281 | Tragic 13.1% |
| Welsh | 0.0 /100 | #282 | Tragic 13.1% |
| English | 0.0 /100 | #283 | Tragic 13.1% |
| Hmong | 0.0 /100 | #284 | Tragic 13.1% |
| Bangladeshis | 0.0 /100 | #285 | Tragic 13.1% |
| Fijians | 0.0 /100 | #286 | Tragic 13.1% |