German vs Belgian Female Disability
COMPARE
German
Belgian
Female Disability
Female Disability Comparison
Germans
Belgians
12.9%
FEMALE DISABILITY
0.1/ 100
METRIC RATING
272nd/ 347
METRIC RANK
12.5%
FEMALE DISABILITY
6.5/ 100
METRIC RATING
231st/ 347
METRIC RANK
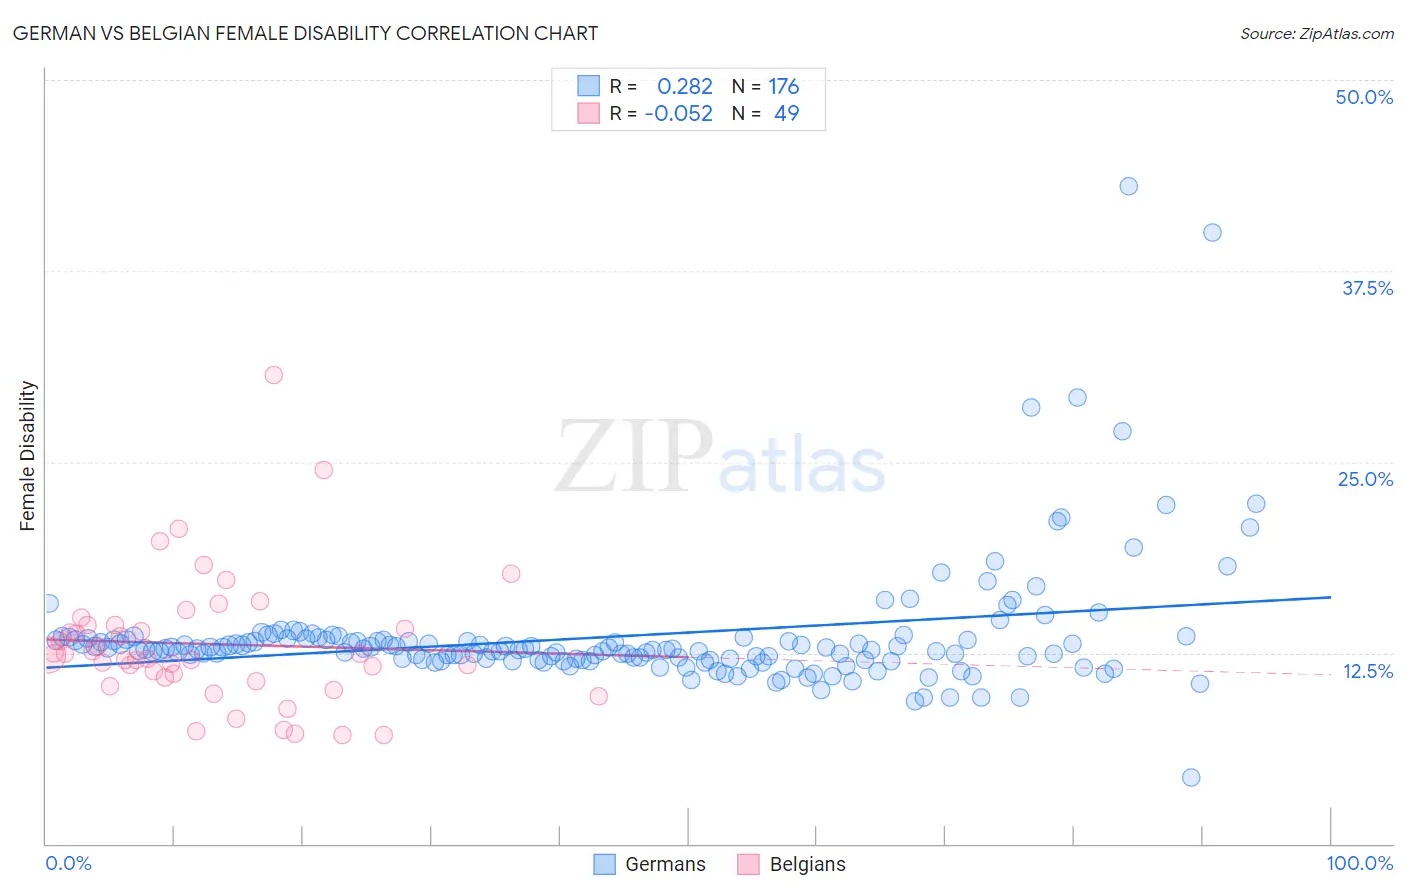
German vs Belgian Female Disability Correlation Chart
The statistical analysis conducted on geographies consisting of 580,718,272 people shows a weak positive correlation between the proportion of Germans and percentage of females with a disability in the United States with a correlation coefficient (R) of 0.282 and weighted average of 12.9%. Similarly, the statistical analysis conducted on geographies consisting of 355,987,027 people shows a slight negative correlation between the proportion of Belgians and percentage of females with a disability in the United States with a correlation coefficient (R) of -0.052 and weighted average of 12.5%, a difference of 3.5%.
Female Disability Correlation Summary
| Measurement | German | Belgian |
| Minimum | 4.3% | 7.1% |
| Maximum | 43.0% | 30.7% |
| Range | 38.7% | 23.6% |
| Mean | 13.6% | 13.1% |
| Median | 12.7% | 12.3% |
| Interquartile 25% (IQ1) | 12.1% | 10.8% |
| Interquartile 75% (IQ3) | 13.4% | 14.3% |
| Interquartile Range (IQR) | 1.3% | 3.5% |
| Standard Deviation (Sample) | 4.2% | 4.4% |
| Standard Deviation (Population) | 4.2% | 4.3% |
Similar Demographics by Female Disability
Demographics Similar to Germans by Female Disability
In terms of female disability, the demographic groups most similar to Germans are Sioux (12.9%, a difference of 0.020%), Portuguese (13.0%, a difference of 0.14%), Cheyenne (13.0%, a difference of 0.19%), Dutch (12.9%, a difference of 0.21%), and Immigrants from Dominica (13.0%, a difference of 0.24%).
| Demographics | Rating | Rank | Female Disability |
| West Indians | 0.5 /100 | #265 | Tragic 12.8% |
| Finns | 0.4 /100 | #266 | Tragic 12.8% |
| Senegalese | 0.4 /100 | #267 | Tragic 12.8% |
| Immigrants | Laos | 0.4 /100 | #268 | Tragic 12.8% |
| Indonesians | 0.4 /100 | #269 | Tragic 12.8% |
| Immigrants | Liberia | 0.3 /100 | #270 | Tragic 12.9% |
| Dutch | 0.2 /100 | #271 | Tragic 12.9% |
| Germans | 0.1 /100 | #272 | Tragic 12.9% |
| Sioux | 0.1 /100 | #273 | Tragic 12.9% |
| Portuguese | 0.1 /100 | #274 | Tragic 13.0% |
| Cheyenne | 0.1 /100 | #275 | Tragic 13.0% |
| Immigrants | Dominica | 0.1 /100 | #276 | Tragic 13.0% |
| Spanish | 0.1 /100 | #277 | Tragic 13.0% |
| Scottish | 0.1 /100 | #278 | Tragic 13.0% |
| Arapaho | 0.1 /100 | #279 | Tragic 13.0% |
Demographics Similar to Belgians by Female Disability
In terms of female disability, the demographic groups most similar to Belgians are Immigrants from Belize (12.5%, a difference of 0.070%), Immigrants from Somalia (12.5%, a difference of 0.090%), Hungarian (12.5%, a difference of 0.11%), Immigrants from Cambodia (12.5%, a difference of 0.18%), and Immigrants from Iraq (12.5%, a difference of 0.19%).
| Demographics | Rating | Rank | Female Disability |
| Belizeans | 9.3 /100 | #224 | Tragic 12.5% |
| Poles | 8.4 /100 | #225 | Tragic 12.5% |
| Hispanics or Latinos | 8.0 /100 | #226 | Tragic 12.5% |
| Assyrians/Chaldeans/Syriacs | 8.0 /100 | #227 | Tragic 12.5% |
| Immigrants | Cambodia | 7.8 /100 | #228 | Tragic 12.5% |
| Hungarians | 7.2 /100 | #229 | Tragic 12.5% |
| Immigrants | Belize | 7.0 /100 | #230 | Tragic 12.5% |
| Belgians | 6.5 /100 | #231 | Tragic 12.5% |
| Immigrants | Somalia | 5.9 /100 | #232 | Tragic 12.5% |
| Immigrants | Iraq | 5.3 /100 | #233 | Tragic 12.5% |
| Scandinavians | 5.3 /100 | #234 | Tragic 12.5% |
| Malaysians | 5.0 /100 | #235 | Tragic 12.5% |
| Immigrants | West Indies | 4.4 /100 | #236 | Tragic 12.6% |
| Slavs | 3.8 /100 | #237 | Tragic 12.6% |
| Yugoslavians | 3.7 /100 | #238 | Tragic 12.6% |