Spanish American vs Immigrants from Kazakhstan Female Disability
COMPARE
Spanish American
Immigrants from Kazakhstan
Female Disability
Female Disability Comparison
Spanish Americans
Immigrants from Kazakhstan
14.0%
FEMALE DISABILITY
0.0/ 100
METRIC RATING
316th/ 347
METRIC RANK
11.8%
FEMALE DISABILITY
97.0/ 100
METRIC RATING
120th/ 347
METRIC RANK
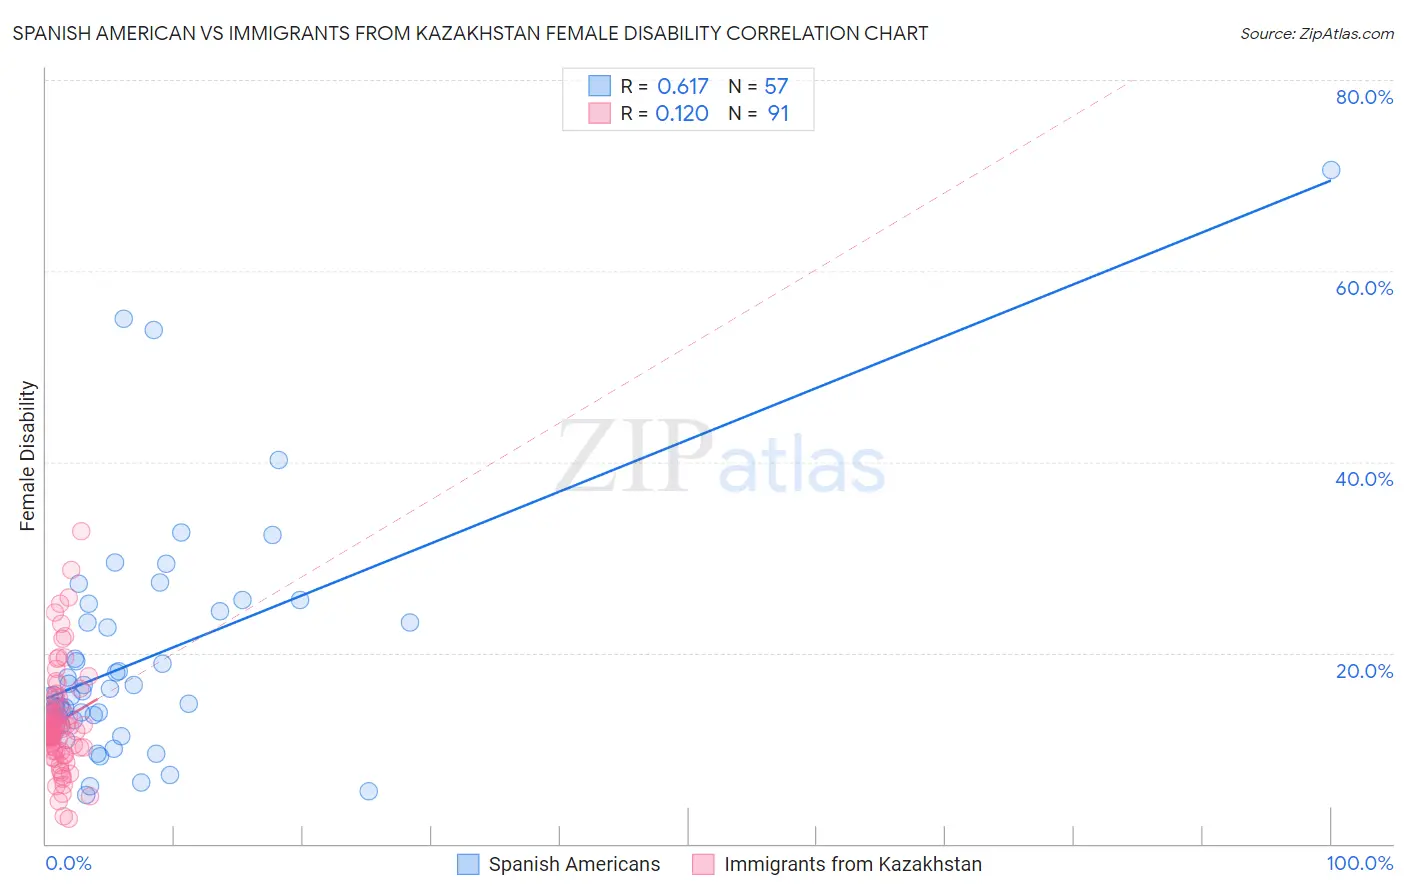
Spanish American vs Immigrants from Kazakhstan Female Disability Correlation Chart
The statistical analysis conducted on geographies consisting of 103,163,564 people shows a significant positive correlation between the proportion of Spanish Americans and percentage of females with a disability in the United States with a correlation coefficient (R) of 0.617 and weighted average of 14.0%. Similarly, the statistical analysis conducted on geographies consisting of 124,443,706 people shows a poor positive correlation between the proportion of Immigrants from Kazakhstan and percentage of females with a disability in the United States with a correlation coefficient (R) of 0.120 and weighted average of 11.8%, a difference of 18.5%.
Female Disability Correlation Summary
| Measurement | Spanish American | Immigrants from Kazakhstan |
| Minimum | 5.1% | 2.6% |
| Maximum | 70.6% | 32.7% |
| Range | 65.5% | 30.1% |
| Mean | 19.3% | 12.7% |
| Median | 15.6% | 11.9% |
| Interquartile 25% (IQ1) | 12.9% | 10.1% |
| Interquartile 75% (IQ3) | 23.8% | 13.8% |
| Interquartile Range (IQR) | 10.8% | 3.8% |
| Standard Deviation (Sample) | 12.2% | 5.2% |
| Standard Deviation (Population) | 12.1% | 5.2% |
Similar Demographics by Female Disability
Demographics Similar to Spanish Americans by Female Disability
In terms of female disability, the demographic groups most similar to Spanish Americans are Chippewa (14.0%, a difference of 0.11%), Paiute (14.0%, a difference of 0.22%), Alaskan Athabascan (13.9%, a difference of 0.36%), Iroquois (14.0%, a difference of 0.50%), and American (14.1%, a difference of 0.85%).
| Demographics | Rating | Rank | Female Disability |
| French American Indians | 0.0 /100 | #309 | Tragic 13.7% |
| Apache | 0.0 /100 | #310 | Tragic 13.7% |
| Hopi | 0.0 /100 | #311 | Tragic 13.7% |
| Delaware | 0.0 /100 | #312 | Tragic 13.8% |
| Blackfeet | 0.0 /100 | #313 | Tragic 13.8% |
| Puget Sound Salish | 0.0 /100 | #314 | Tragic 13.8% |
| Alaskan Athabascans | 0.0 /100 | #315 | Tragic 13.9% |
| Spanish Americans | 0.0 /100 | #316 | Tragic 14.0% |
| Chippewa | 0.0 /100 | #317 | Tragic 14.0% |
| Paiute | 0.0 /100 | #318 | Tragic 14.0% |
| Iroquois | 0.0 /100 | #319 | Tragic 14.0% |
| Americans | 0.0 /100 | #320 | Tragic 14.1% |
| Potawatomi | 0.0 /100 | #321 | Tragic 14.1% |
| Pueblo | 0.0 /100 | #322 | Tragic 14.1% |
| Blacks/African Americans | 0.0 /100 | #323 | Tragic 14.1% |
Demographics Similar to Immigrants from Kazakhstan by Female Disability
In terms of female disability, the demographic groups most similar to Immigrants from Kazakhstan are Immigrants from Netherlands (11.8%, a difference of 0.030%), Immigrants from North Macedonia (11.8%, a difference of 0.040%), Immigrants from Uganda (11.8%, a difference of 0.080%), Immigrants from Eastern Europe (11.8%, a difference of 0.090%), and Immigrants from Nigeria (11.8%, a difference of 0.090%).
| Demographics | Rating | Rank | Female Disability |
| Immigrants | Belarus | 97.8 /100 | #113 | Exceptional 11.8% |
| South Africans | 97.7 /100 | #114 | Exceptional 11.8% |
| Brazilians | 97.7 /100 | #115 | Exceptional 11.8% |
| Immigrants | Morocco | 97.6 /100 | #116 | Exceptional 11.8% |
| Immigrants | Eastern Europe | 97.2 /100 | #117 | Exceptional 11.8% |
| Immigrants | Nigeria | 97.2 /100 | #118 | Exceptional 11.8% |
| Immigrants | Uganda | 97.2 /100 | #119 | Exceptional 11.8% |
| Immigrants | Kazakhstan | 97.0 /100 | #120 | Exceptional 11.8% |
| Immigrants | Netherlands | 96.9 /100 | #121 | Exceptional 11.8% |
| Immigrants | North Macedonia | 96.8 /100 | #122 | Exceptional 11.8% |
| Immigrants | Croatia | 96.7 /100 | #123 | Exceptional 11.8% |
| Russians | 96.5 /100 | #124 | Exceptional 11.8% |
| Immigrants | Italy | 96.4 /100 | #125 | Exceptional 11.8% |
| Immigrants | Europe | 96.2 /100 | #126 | Exceptional 11.8% |
| South American Indians | 95.8 /100 | #127 | Exceptional 11.8% |