Cypriot vs Immigrants from Hong Kong Disability Age 65 to 74
COMPARE
Cypriot
Immigrants from Hong Kong
Disability Age 65 to 74
Disability Age 65 to 74 Comparison
Cypriots
Immigrants from Hong Kong
20.1%
DISABILITY AGE 65 TO 74
100.0/ 100
METRIC RATING
7th/ 347
METRIC RANK
19.9%
DISABILITY AGE 65 TO 74
100.0/ 100
METRIC RATING
4th/ 347
METRIC RANK
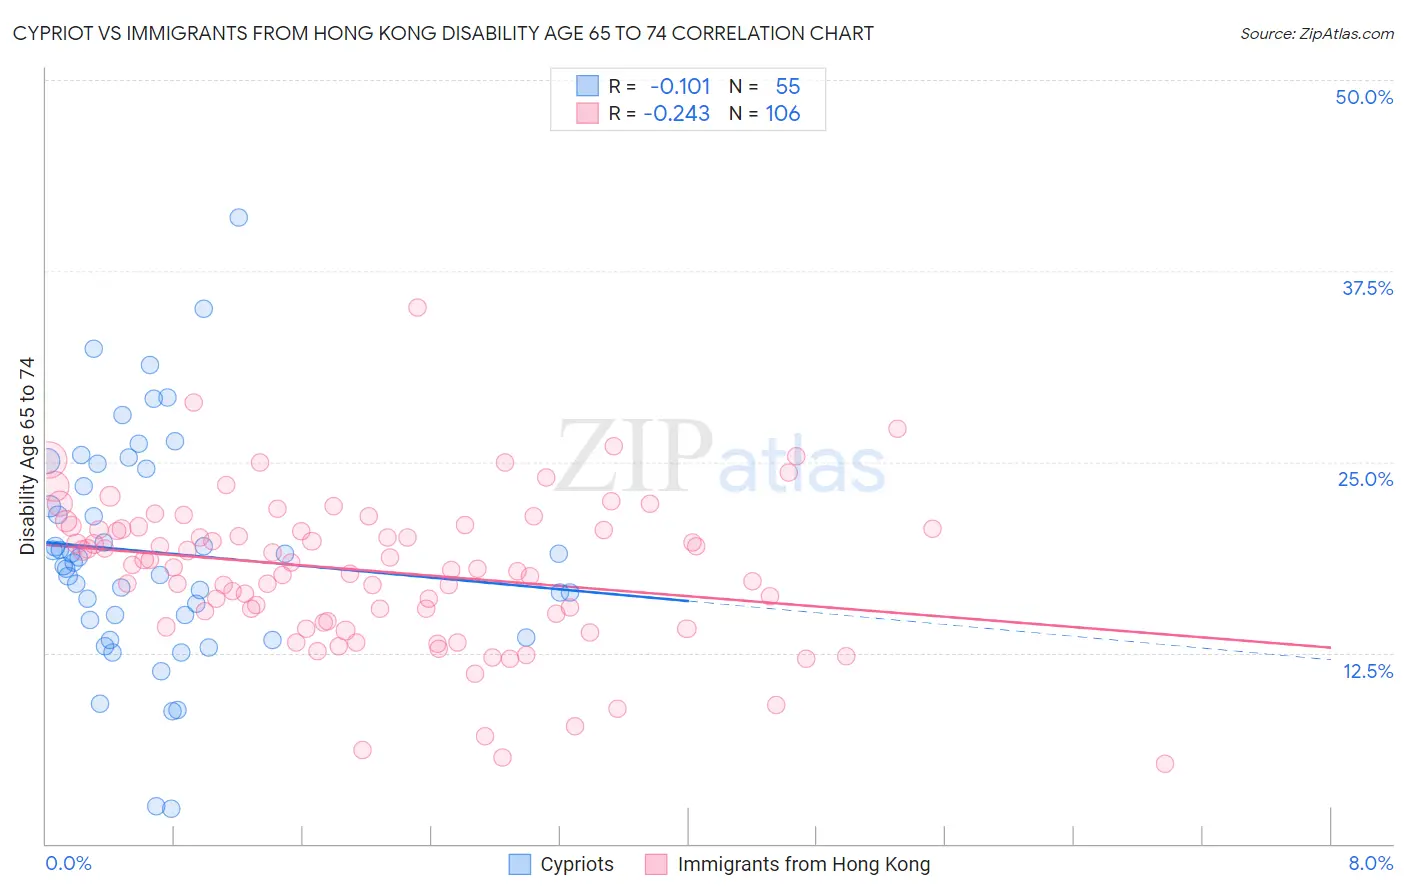
Cypriot vs Immigrants from Hong Kong Disability Age 65 to 74 Correlation Chart
The statistical analysis conducted on geographies consisting of 61,803,006 people shows a poor negative correlation between the proportion of Cypriots and percentage of population with a disability between the ages 65 and 75 in the United States with a correlation coefficient (R) of -0.101 and weighted average of 20.1%. Similarly, the statistical analysis conducted on geographies consisting of 253,698,162 people shows a weak negative correlation between the proportion of Immigrants from Hong Kong and percentage of population with a disability between the ages 65 and 75 in the United States with a correlation coefficient (R) of -0.243 and weighted average of 19.9%, a difference of 1.1%.
Disability Age 65 to 74 Correlation Summary
| Measurement | Cypriot | Immigrants from Hong Kong |
| Minimum | 2.3% | 5.3% |
| Maximum | 41.0% | 35.1% |
| Range | 38.6% | 29.8% |
| Mean | 19.1% | 17.8% |
| Median | 18.4% | 18.2% |
| Interquartile 25% (IQ1) | 14.6% | 14.6% |
| Interquartile 75% (IQ3) | 24.6% | 20.6% |
| Interquartile Range (IQR) | 9.9% | 6.0% |
| Standard Deviation (Sample) | 7.4% | 5.0% |
| Standard Deviation (Population) | 7.4% | 4.9% |
Demographics Similar to Cypriots and Immigrants from Hong Kong by Disability Age 65 to 74
In terms of disability age 65 to 74, the demographic groups most similar to Cypriots are Thai (20.1%, a difference of 0.040%), Iranian (19.9%, a difference of 0.67%), Immigrants from Israel (19.9%, a difference of 0.78%), Immigrants from China (20.3%, a difference of 0.99%), and Immigrants from Eastern Asia (20.3%, a difference of 1.1%). Similarly, the demographic groups most similar to Immigrants from Hong Kong are Immigrants from Israel (19.9%, a difference of 0.30%), Iranian (19.9%, a difference of 0.41%), Immigrants from India (19.7%, a difference of 0.84%), Thai (20.1%, a difference of 1.1%), and Immigrants from China (20.3%, a difference of 2.1%).
| Demographics | Rating | Rank | Disability Age 65 to 74 |
| Immigrants | Taiwan | 100.0 /100 | #1 | Exceptional 18.8% |
| Filipinos | 100.0 /100 | #2 | Exceptional 19.0% |
| Immigrants | India | 100.0 /100 | #3 | Exceptional 19.7% |
| Immigrants | Hong Kong | 100.0 /100 | #4 | Exceptional 19.9% |
| Immigrants | Israel | 100.0 /100 | #5 | Exceptional 19.9% |
| Iranians | 100.0 /100 | #6 | Exceptional 19.9% |
| Cypriots | 100.0 /100 | #7 | Exceptional 20.1% |
| Thais | 100.0 /100 | #8 | Exceptional 20.1% |
| Immigrants | China | 100.0 /100 | #9 | Exceptional 20.3% |
| Immigrants | Eastern Asia | 100.0 /100 | #10 | Exceptional 20.3% |
| Immigrants | Ireland | 100.0 /100 | #11 | Exceptional 20.3% |
| Immigrants | Korea | 100.0 /100 | #12 | Exceptional 20.4% |
| Immigrants | Singapore | 100.0 /100 | #13 | Exceptional 20.4% |
| Indians (Asian) | 100.0 /100 | #14 | Exceptional 20.5% |
| Paraguayans | 100.0 /100 | #15 | Exceptional 20.5% |
| Immigrants | Lithuania | 100.0 /100 | #16 | Exceptional 20.5% |
| Immigrants | South Central Asia | 100.0 /100 | #17 | Exceptional 20.6% |
| Eastern Europeans | 100.0 /100 | #18 | Exceptional 20.6% |
| Burmese | 100.0 /100 | #19 | Exceptional 20.6% |
| Okinawans | 100.0 /100 | #20 | Exceptional 20.7% |