Immigrants from Africa vs Immigrants from Hong Kong Disability Age 65 to 74

COMPARE

Immigrants from Africa
Race
Ancestry
AfghanAfricanAlaska NativeAlaskan AthabascanAlbanianAleutAlsatianAmericanApacheArabArapahoArgentineanArmenianAssyrian/Chaldean/SyriacAustralianAustrianBahamianBangladeshiBarbadianBasqueBelgianBelizeanBermudanBhutaneseBlackfeetBolivianBrazilianBritishBritish West IndianBulgarianBurmeseCajunCambodianCanadianCape VerdeanCarpatho RusynCelticCentral AmericanCentral American IndianCherokeeCheyenneChickasawChileanChineseChippewaChoctawColombianColvilleComancheCosta RicanCreeCreekCroatianCrowCubanCypriotCzechCzechoslovakianDanishDelawareDominicanDutchDutch West IndianEastern EuropeanEcuadorianEgyptianEnglishEstonianEthiopianEuropeanFijianFilipinoFinnishFrenchFrench American IndianFrench CanadianGermanGerman RussianGhanaianGreekGuamanian/ChamorroGuatemalanGuyaneseHaitianHmongHonduranHopiHoumaHungarianIcelanderIndian (Asian)IndonesianInupiatIranianIraqiIrishIroquoisIsraeliItalianJamaicanJapaneseJordanianKenyanKiowaKoreanLaotianLatvianLebaneseLiberianLithuanianLumbeeLuxembourgerMacedonianMalaysianMalteseMarshalleseMenomineeMexicanMexican American IndianMongolianMoroccanNative HawaiianNavajoNepaleseNew ZealanderNicaraguanNigerianNorthern EuropeanNorwegianOkinawanOsageOttawaPaiutePakistaniPalestinianPanamanianParaguayanPennsylvania GermanPeruvianPimaPolishPortuguesePotawatomiPuebloPuerto RicanPuget Sound SalishRomanianRussianSalvadoranSamoanScandinavianScotch-IrishScottishSeminoleSenegaleseSerbianShoshoneSierra LeoneanSiouxSlavicSlovakSloveneSomaliSouth AfricanSouth AmericanSouth American IndianSoviet UnionSpaniardSpanishSpanish AmericanSpanish American IndianSri LankanSubsaharan AfricanSudaneseSwedishSwissSyrianTaiwaneseThaiTlingit-HaidaTohono O'OdhamTonganTrinidadian and TobagonianTsimshianTurkishU.S. Virgin IslanderUgandanUkrainianUruguayanUteVenezuelanVietnameseWelshWest IndianYakamaYaquiYugoslavianYumanYup'ikZimbabwean
Immigration
NonimmigrantsImmigrantsAfghanistanAfricaAlbaniaArgentinaArmeniaAsiaAustraliaAustriaBahamasBangladeshBarbadosBelarusBelgiumBelizeBoliviaBosnia and HerzegovinaBrazilBulgariaBurma/MyanmarCabo VerdeCambodiaCameroonCanadaCaribbeanCentral AmericaChileChinaColombiaCongoCosta RicaCroatiaCubaCzechoslovakiaDenmarkDominicaDominican RepublicEastern AfricaEastern AsiaEastern EuropeEcuadorEgyptEl SalvadorEnglandEritreaEthiopiaEuropeFijiFranceGermanyGhanaGreeceGrenadaGuatemalaGuyanaHaitiHondurasHungaryIndiaIndonesiaIranIraqIrelandIsraelItalyJamaicaJapanJordanKazakhstanKenyaKoreaKuwaitLaosLatin AmericaLatviaLebanonLiberiaLithuaniaMalaysiaMexicoMicronesiaMiddle AfricaMoldovaMoroccoNepalNetherlandsNicaraguaNigeriaNorth AmericaNorth MacedoniaNorthern AfricaNorthern EuropeNorwayOceaniaPakistanPanamaPeruPhilippinesPolandPortugalRomaniaRussiaSaudi ArabiaScotlandSenegalSerbiaSierra LeoneSingaporeSomaliaSouth AfricaSouth AmericaSouth Central AsiaSouth Eastern AsiaSouthern EuropeSpainSri LankaSt. Vincent and the GrenadinesSudanSwedenSwitzerlandSyriaTaiwanThailandTrinidad and TobagoTurkeyUgandaUkraineUruguayUzbekistanVenezuelaVietnamWest IndiesWestern AfricaWestern AsiaWestern EuropeYemenZaireZimbabweAzores
Immigrants from Hong Kong
Race
Ancestry
AfghanAfricanAlaska NativeAlaskan AthabascanAlbanianAleutAlsatianAmericanApacheArabArapahoArgentineanArmenianAssyrian/Chaldean/SyriacAustralianAustrianBahamianBangladeshiBarbadianBasqueBelgianBelizeanBermudanBhutaneseBlackfeetBolivianBrazilianBritishBritish West IndianBulgarianBurmeseCajunCambodianCanadianCape VerdeanCarpatho RusynCelticCentral AmericanCentral American IndianCherokeeCheyenneChickasawChileanChineseChippewaChoctawColombianColvilleComancheCosta RicanCreeCreekCroatianCrowCubanCypriotCzechCzechoslovakianDanishDelawareDominicanDutchDutch West IndianEastern EuropeanEcuadorianEgyptianEnglishEstonianEthiopianEuropeanFijianFilipinoFinnishFrenchFrench American IndianFrench CanadianGermanGerman RussianGhanaianGreekGuamanian/ChamorroGuatemalanGuyaneseHaitianHmongHonduranHopiHoumaHungarianIcelanderIndian (Asian)IndonesianInupiatIranianIraqiIrishIroquoisIsraeliItalianJamaicanJapaneseJordanianKenyanKiowaKoreanLaotianLatvianLebaneseLiberianLithuanianLumbeeLuxembourgerMacedonianMalaysianMalteseMarshalleseMenomineeMexicanMexican American IndianMongolianMoroccanNative HawaiianNavajoNepaleseNew ZealanderNicaraguanNigerianNorthern EuropeanNorwegianOkinawanOsageOttawaPaiutePakistaniPalestinianPanamanianParaguayanPennsylvania GermanPeruvianPimaPolishPortuguesePotawatomiPuebloPuerto RicanPuget Sound SalishRomanianRussianSalvadoranSamoanScandinavianScotch-IrishScottishSeminoleSenegaleseSerbianShoshoneSierra LeoneanSiouxSlavicSlovakSloveneSomaliSouth AfricanSouth AmericanSouth American IndianSoviet UnionSpaniardSpanishSpanish AmericanSpanish American IndianSri LankanSubsaharan AfricanSudaneseSwedishSwissSyrianTaiwaneseThaiTlingit-HaidaTohono O'OdhamTonganTrinidadian and TobagonianTsimshianTurkishU.S. Virgin IslanderUgandanUkrainianUruguayanUteVenezuelanVietnameseWelshWest IndianYakamaYaquiYugoslavianYumanYup'ikZimbabwean
Immigration
NonimmigrantsImmigrantsAfghanistanAlbaniaArgentinaArmeniaAsiaAustraliaAustriaBahamasBangladeshBarbadosBelarusBelgiumBelizeBoliviaBosnia and HerzegovinaBrazilBulgariaBurma/MyanmarCabo VerdeCambodiaCameroonCanadaCaribbeanCentral AmericaChileChinaColombiaCongoCosta RicaCroatiaCubaCzechoslovakiaDenmarkDominicaDominican RepublicEastern AfricaEastern AsiaEastern EuropeEcuadorEgyptEl SalvadorEnglandEritreaEthiopiaEuropeFijiFranceGermanyGhanaGreeceGrenadaGuatemalaGuyanaHaitiHondurasHong KongHungaryIndiaIndonesiaIranIraqIrelandIsraelItalyJamaicaJapanJordanKazakhstanKenyaKoreaKuwaitLaosLatin AmericaLatviaLebanonLiberiaLithuaniaMalaysiaMexicoMicronesiaMiddle AfricaMoldovaMoroccoNepalNetherlandsNicaraguaNigeriaNorth AmericaNorth MacedoniaNorthern AfricaNorthern EuropeNorwayOceaniaPakistanPanamaPeruPhilippinesPolandPortugalRomaniaRussiaSaudi ArabiaScotlandSenegalSerbiaSierra LeoneSingaporeSomaliaSouth AfricaSouth AmericaSouth Central AsiaSouth Eastern AsiaSouthern EuropeSpainSri LankaSt. Vincent and the GrenadinesSudanSwedenSwitzerlandSyriaTaiwanThailandTrinidad and TobagoTurkeyUgandaUkraineUruguayUzbekistanVenezuelaVietnamWest IndiesWestern AfricaWestern AsiaWestern EuropeYemenZaireZimbabweAzores
Disability Age 65 to 74
Income
Poverty
Unemployment
Labor Participation
Family Structure
Vehicle Availability
Education Level
Disability

Disability Age 65 to 74 Comparison

Immigrants from Africa

Immigrants from Hong Kong

Fair
Exceptional
23.7%
DISABILITY AGE 65 TO 74
24.4/ 100
METRIC RATING
198th/ 347
METRIC RANK
19.9%
DISABILITY AGE 65 TO 74
100.0/ 100
METRIC RATING
4th/ 347
METRIC RANK

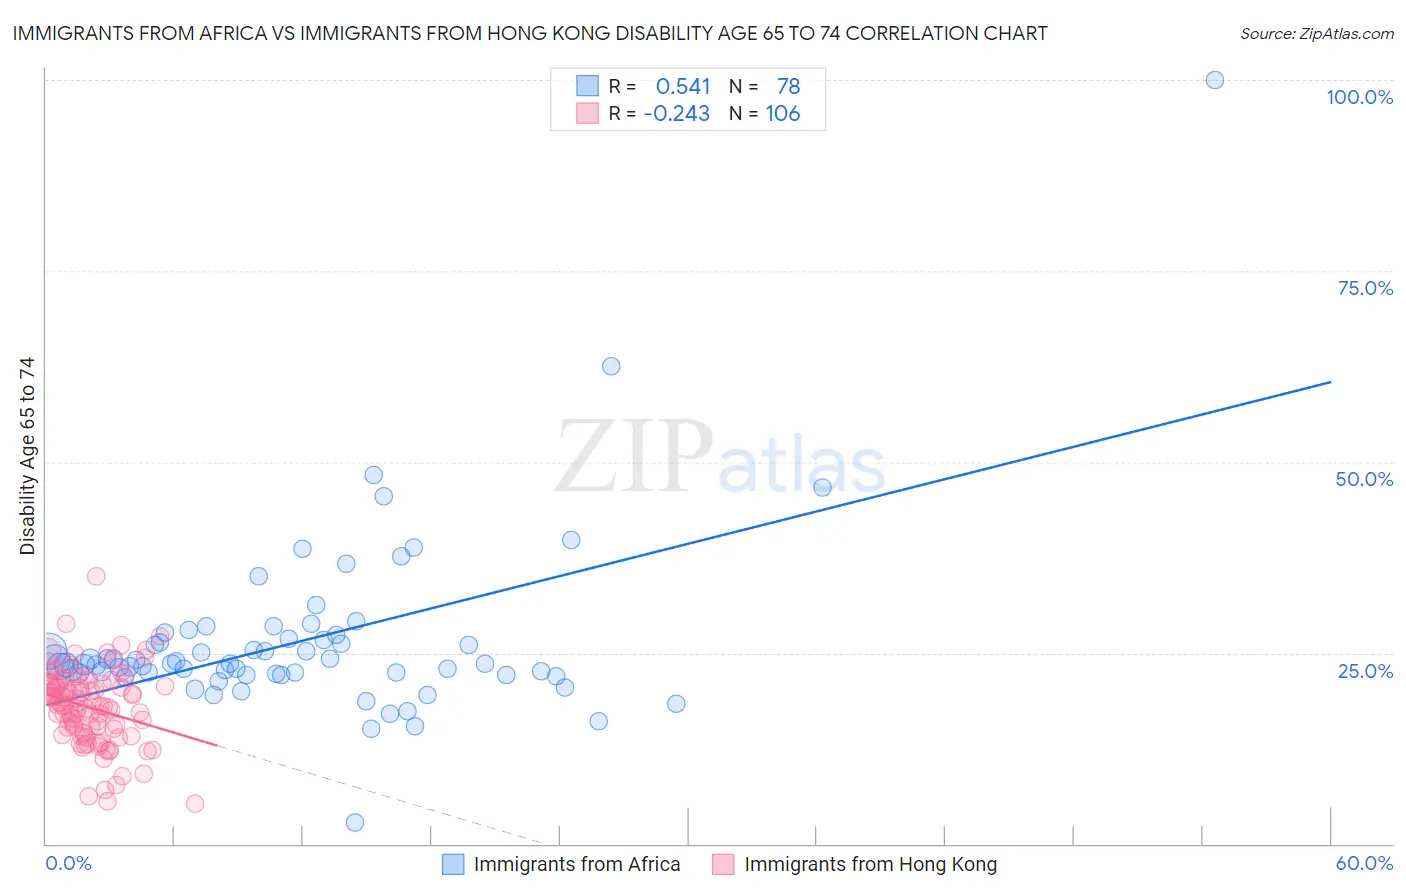
Immigrants from Africa vs Immigrants from Hong Kong Disability Age 65 to 74 Correlation Chart

The statistical analysis conducted on geographies consisting of 467,985,129 people shows a substantial positive correlation between the proportion of Immigrants from Africa and percentage of population with a disability between the ages 65 and 75 in the United States with a correlation coefficient (R) of 0.541 and weighted average of 23.7%. Similarly, the statistical analysis conducted on geographies consisting of 253,698,162 people shows a weak negative correlation between the proportion of Immigrants from Hong Kong and percentage of population with a disability between the ages 65 and 75 in the United States with a correlation coefficient (R) of -0.243 and weighted average of 19.9%, a difference of 19.5%.
Immigrants from Africa vs Immigrants from Hong Kong Disability Age 65 to 74

Disability Age 65 to 74 Correlation Summary

MeasurementImmigrants from AfricaImmigrants from Hong Kong
Minimum2.8%5.3%
Maximum100.0%35.1%
Range97.2%29.8%
Mean26.5%17.8%
Median23.5%18.2%
Interquartile 25% (IQ1)22.3%14.6%
Interquartile 75% (IQ3)26.9%20.6%
Interquartile Range (IQR)4.6%6.0%
Standard Deviation (Sample)11.8%5.0%
Standard Deviation (Population)11.7%4.9%

Similar Demographics by Disability Age 65 to 74

Demographics Similar to Immigrants from Africa by Disability Age 65 to 74

In terms of disability age 65 to 74, the demographic groups most similar to Immigrants from Africa are Welsh (23.7%, a difference of 0.010%), French Canadian (23.7%, a difference of 0.040%), Immigrants from Ecuador (23.7%, a difference of 0.040%), Immigrants from Bahamas (23.7%, a difference of 0.080%), and Kenyan (23.7%, a difference of 0.10%).
DemographicsRating | RankDisability Age 65 to 74
Immigrants | Bangladesh
30.2
/100
|
#191
Fair
23.6%
Ecuadorians
29.7
/100
|
#192
Fair
23.6%
English
28.5
/100
|
#193
Fair
23.6%
Sudanese
27.8
/100
|
#194
Fair
23.7%
Immigrants | St. Vincent and the Grenadines
26.1
/100
|
#195
Fair
23.7%
Immigrants | Trinidad and Tobago
26.1
/100
|
#196
Fair
23.7%
Immigrants | Immigrants
25.8
/100
|
#197
Fair
23.7%
Immigrants | Africa
24.4
/100
|
#198
Fair
23.7%
Welsh
24.3
/100
|
#199
Fair
23.7%
French Canadians
24.0
/100
|
#200
Fair
23.7%
Immigrants | Ecuador
23.9
/100
|
#201
Fair
23.7%
Immigrants | Bahamas
23.3
/100
|
#202
Fair
23.7%
Kenyans
23.2
/100
|
#203
Fair
23.7%
Immigrants | Grenada
22.1
/100
|
#204
Fair
23.8%
Tongans
20.8
/100
|
#205
Fair
23.8%

Demographics Similar to Immigrants from Hong Kong by Disability Age 65 to 74

In terms of disability age 65 to 74, the demographic groups most similar to Immigrants from Hong Kong are Immigrants from Israel (19.9%, a difference of 0.30%), Iranian (19.9%, a difference of 0.41%), Immigrants from India (19.7%, a difference of 0.84%), Cypriot (20.1%, a difference of 1.1%), and Thai (20.1%, a difference of 1.1%).
DemographicsRating | RankDisability Age 65 to 74
Immigrants | Taiwan
100.0
/100
|
#1
Exceptional
18.8%
Filipinos
100.0
/100
|
#2
Exceptional
19.0%
Immigrants | India
100.0
/100
|
#3
Exceptional
19.7%
Immigrants | Hong Kong
100.0
/100
|
#4
Exceptional
19.9%
Immigrants | Israel
100.0
/100
|
#5
Exceptional
19.9%
Iranians
100.0
/100
|
#6
Exceptional
19.9%
Cypriots
100.0
/100
|
#7
Exceptional
20.1%
Thais
100.0
/100
|
#8
Exceptional
20.1%
Immigrants | China
100.0
/100
|
#9
Exceptional
20.3%
Immigrants | Eastern Asia
100.0
/100
|
#10
Exceptional
20.3%
Immigrants | Ireland
100.0
/100
|
#11
Exceptional
20.3%
Immigrants | Korea
100.0
/100
|
#12
Exceptional
20.4%
Immigrants | Singapore
100.0
/100
|
#13
Exceptional
20.4%
Indians (Asian)
100.0
/100
|
#14
Exceptional
20.5%
Paraguayans
100.0
/100
|
#15
Exceptional
20.5%