Spanish American Indian vs Immigrants from Vietnam Disability Age 65 to 74
COMPARE
Spanish American Indian
Immigrants from Vietnam
Disability Age 65 to 74
Disability Age 65 to 74 Comparison
Spanish American Indians
Immigrants from Vietnam
26.4%
DISABILITY AGE 65 TO 74
0.0/ 100
METRIC RATING
291st/ 347
METRIC RANK
23.1%
DISABILITY AGE 65 TO 74
69.1/ 100
METRIC RATING
158th/ 347
METRIC RANK
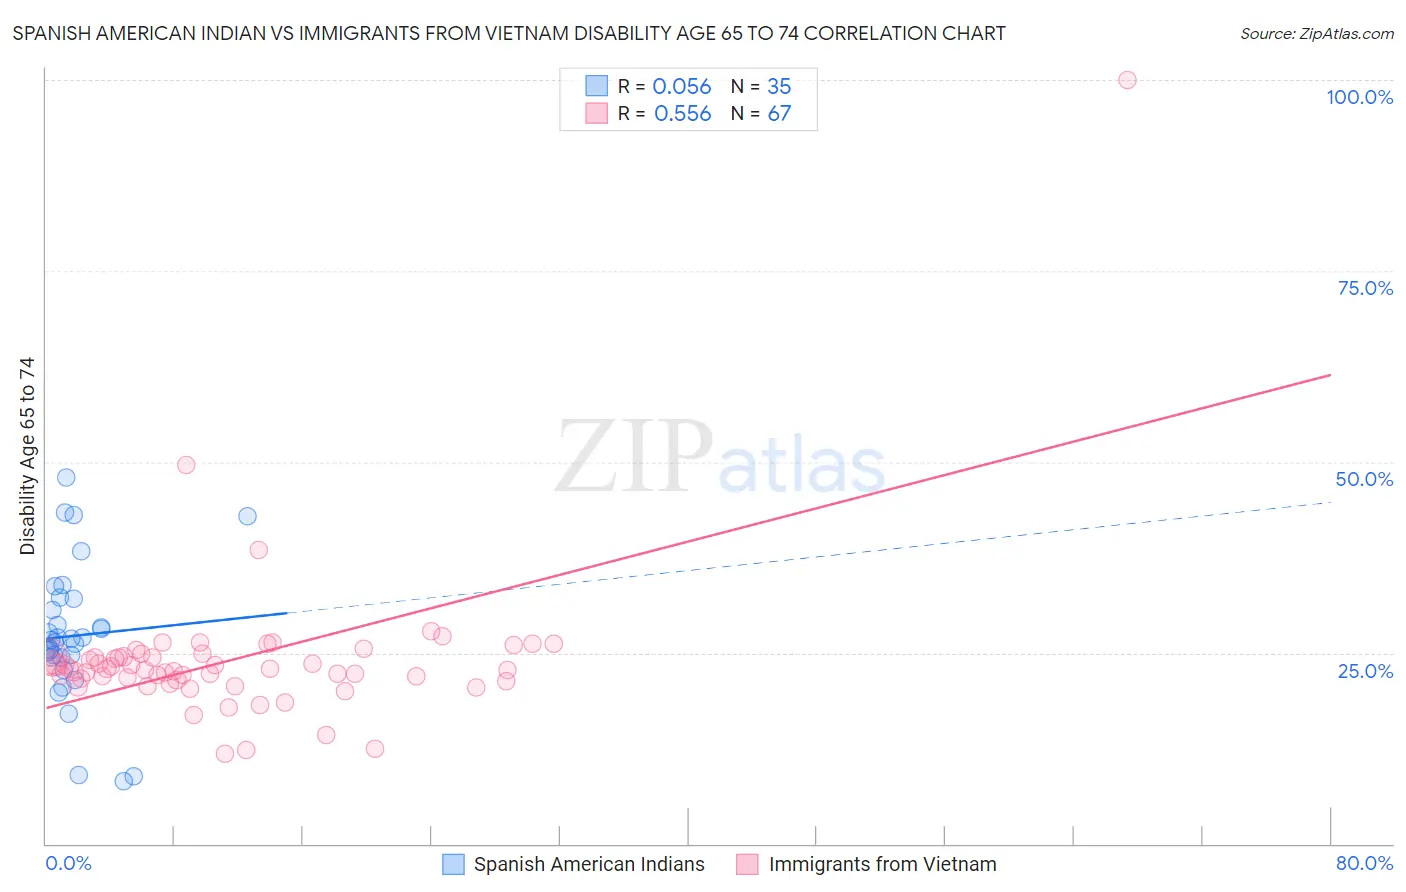
Spanish American Indian vs Immigrants from Vietnam Disability Age 65 to 74 Correlation Chart
The statistical analysis conducted on geographies consisting of 73,139,932 people shows a slight positive correlation between the proportion of Spanish American Indians and percentage of population with a disability between the ages 65 and 75 in the United States with a correlation coefficient (R) of 0.056 and weighted average of 26.4%. Similarly, the statistical analysis conducted on geographies consisting of 404,135,532 people shows a substantial positive correlation between the proportion of Immigrants from Vietnam and percentage of population with a disability between the ages 65 and 75 in the United States with a correlation coefficient (R) of 0.556 and weighted average of 23.1%, a difference of 14.3%.
Disability Age 65 to 74 Correlation Summary
| Measurement | Spanish American Indian | Immigrants from Vietnam |
| Minimum | 8.2% | 11.7% |
| Maximum | 47.9% | 100.0% |
| Range | 39.7% | 88.3% |
| Mean | 27.2% | 24.2% |
| Median | 26.7% | 22.9% |
| Interquartile 25% (IQ1) | 24.4% | 21.4% |
| Interquartile 75% (IQ3) | 32.1% | 24.5% |
| Interquartile Range (IQR) | 7.7% | 3.1% |
| Standard Deviation (Sample) | 9.1% | 10.7% |
| Standard Deviation (Population) | 8.9% | 10.6% |
Similar Demographics by Disability Age 65 to 74
Demographics Similar to Spanish American Indians by Disability Age 65 to 74
In terms of disability age 65 to 74, the demographic groups most similar to Spanish American Indians are Immigrants from Cabo Verde (26.3%, a difference of 0.20%), African (26.2%, a difference of 0.50%), Mexican American Indian (26.2%, a difference of 0.82%), Blackfeet (26.6%, a difference of 0.88%), and Immigrants from Laos (26.1%, a difference of 0.91%).
| Demographics | Rating | Rank | Disability Age 65 to 74 |
| Immigrants | Azores | 0.0 /100 | #284 | Tragic 26.0% |
| Immigrants | Congo | 0.0 /100 | #285 | Tragic 26.0% |
| Immigrants | Micronesia | 0.0 /100 | #286 | Tragic 26.1% |
| Immigrants | Laos | 0.0 /100 | #287 | Tragic 26.1% |
| Mexican American Indians | 0.0 /100 | #288 | Tragic 26.2% |
| Africans | 0.0 /100 | #289 | Tragic 26.2% |
| Immigrants | Cabo Verde | 0.0 /100 | #290 | Tragic 26.3% |
| Spanish American Indians | 0.0 /100 | #291 | Tragic 26.4% |
| Blackfeet | 0.0 /100 | #292 | Tragic 26.6% |
| Immigrants | Central America | 0.0 /100 | #293 | Tragic 26.6% |
| Dominicans | 0.0 /100 | #294 | Tragic 26.7% |
| Hispanics or Latinos | 0.0 /100 | #295 | Tragic 26.7% |
| Bangladeshis | 0.0 /100 | #296 | Tragic 26.8% |
| Fijians | 0.0 /100 | #297 | Tragic 27.0% |
| Immigrants | Yemen | 0.0 /100 | #298 | Tragic 27.0% |
Demographics Similar to Immigrants from Vietnam by Disability Age 65 to 74
In terms of disability age 65 to 74, the demographic groups most similar to Immigrants from Vietnam are Czechoslovakian (23.0%, a difference of 0.23%), South American Indian (23.1%, a difference of 0.24%), Korean (23.1%, a difference of 0.33%), Immigrants from Western Asia (23.0%, a difference of 0.34%), and British (23.0%, a difference of 0.35%).
| Demographics | Rating | Rank | Disability Age 65 to 74 |
| Immigrants | Morocco | 77.6 /100 | #151 | Good 22.9% |
| Finns | 76.5 /100 | #152 | Good 22.9% |
| Slavs | 75.2 /100 | #153 | Good 23.0% |
| Sri Lankans | 74.0 /100 | #154 | Good 23.0% |
| British | 73.9 /100 | #155 | Good 23.0% |
| Immigrants | Western Asia | 73.8 /100 | #156 | Good 23.0% |
| Czechoslovakians | 72.4 /100 | #157 | Good 23.0% |
| Immigrants | Vietnam | 69.1 /100 | #158 | Good 23.1% |
| South American Indians | 65.5 /100 | #159 | Good 23.1% |
| Koreans | 64.2 /100 | #160 | Good 23.1% |
| Immigrants | Cameroon | 63.8 /100 | #161 | Good 23.1% |
| Europeans | 61.2 /100 | #162 | Good 23.2% |
| Immigrants | Philippines | 61.1 /100 | #163 | Good 23.2% |
| Sierra Leoneans | 60.9 /100 | #164 | Good 23.2% |
| Vietnamese | 60.8 /100 | #165 | Good 23.2% |