South American Indian vs Immigrants from Burma/Myanmar Disability
COMPARE
South American Indian
Immigrants from Burma/Myanmar
Disability
Disability Comparison
South American Indians
Immigrants from Burma/Myanmar
11.4%
DISABILITY
92.2/ 100
METRIC RATING
124th/ 347
METRIC RANK
11.8%
DISABILITY
28.5/ 100
METRIC RATING
185th/ 347
METRIC RANK
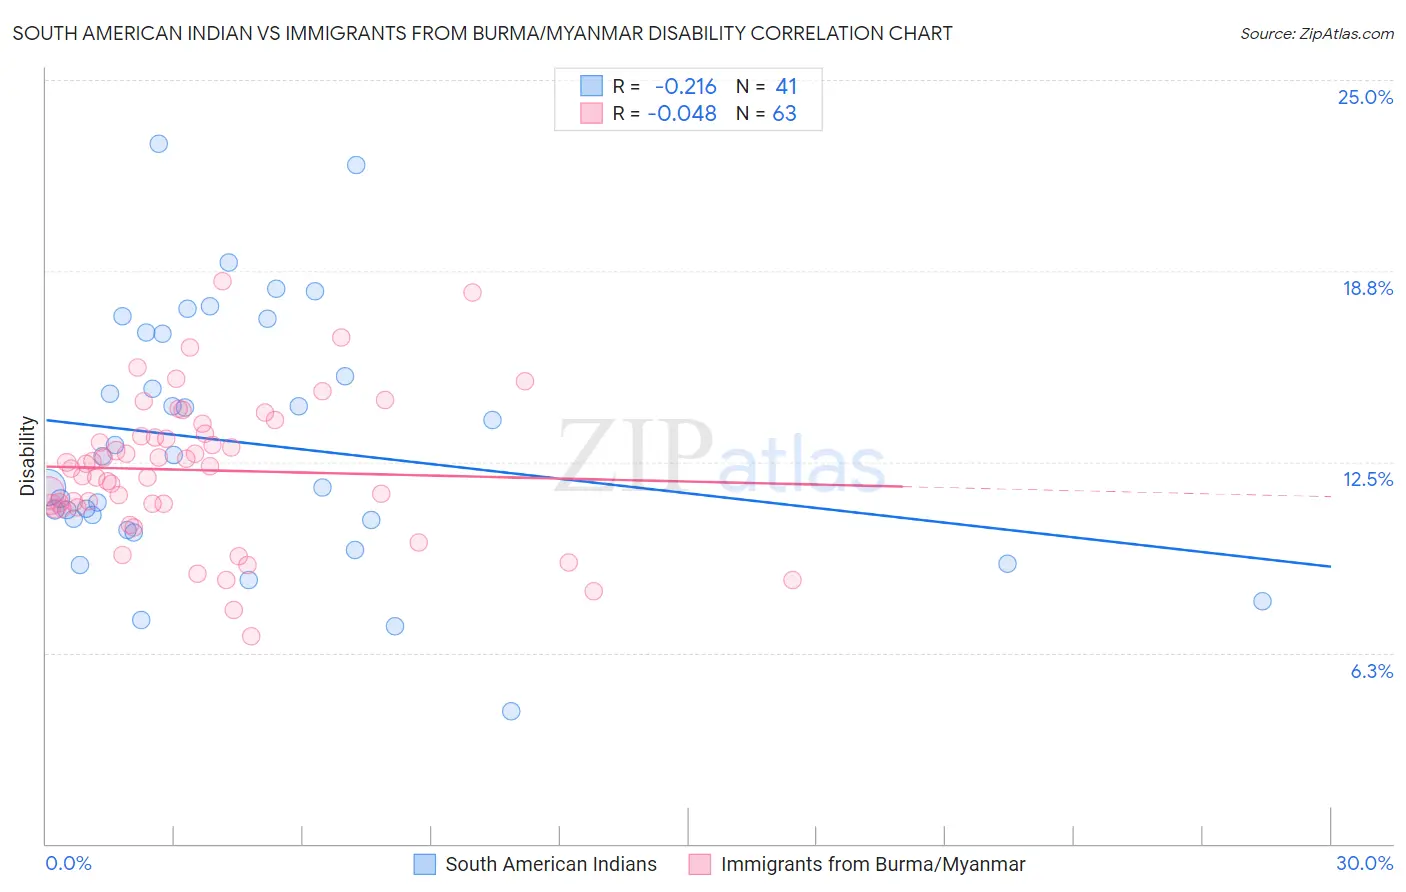
South American Indian vs Immigrants from Burma/Myanmar Disability Correlation Chart
The statistical analysis conducted on geographies consisting of 164,561,915 people shows a weak negative correlation between the proportion of South American Indians and percentage of population with a disability in the United States with a correlation coefficient (R) of -0.216 and weighted average of 11.4%. Similarly, the statistical analysis conducted on geographies consisting of 172,347,454 people shows no correlation between the proportion of Immigrants from Burma/Myanmar and percentage of population with a disability in the United States with a correlation coefficient (R) of -0.048 and weighted average of 11.8%, a difference of 3.9%.
Disability Correlation Summary
| Measurement | South American Indian | Immigrants from Burma/Myanmar |
| Minimum | 4.3% | 6.8% |
| Maximum | 22.9% | 18.4% |
| Range | 18.6% | 11.6% |
| Mean | 13.1% | 12.2% |
| Median | 12.7% | 12.4% |
| Interquartile 25% (IQ1) | 10.4% | 11.0% |
| Interquartile 75% (IQ3) | 16.7% | 13.4% |
| Interquartile Range (IQR) | 6.3% | 2.4% |
| Standard Deviation (Sample) | 4.1% | 2.3% |
| Standard Deviation (Population) | 4.1% | 2.3% |
Similar Demographics by Disability
Demographics Similar to South American Indians by Disability
In terms of disability, the demographic groups most similar to South American Indians are South African (11.4%, a difference of 0.020%), Costa Rican (11.4%, a difference of 0.040%), Brazilian (11.4%, a difference of 0.19%), Immigrants from Latvia (11.4%, a difference of 0.19%), and Immigrants from North Macedonia (11.4%, a difference of 0.22%).
| Demographics | Rating | Rank | Disability |
| Luxembourgers | 93.9 /100 | #117 | Exceptional 11.3% |
| Koreans | 93.8 /100 | #118 | Exceptional 11.3% |
| Central Americans | 93.5 /100 | #119 | Exceptional 11.4% |
| Immigrants | North Macedonia | 93.5 /100 | #120 | Exceptional 11.4% |
| Immigrants | Costa Rica | 93.4 /100 | #121 | Exceptional 11.4% |
| Brazilians | 93.3 /100 | #122 | Exceptional 11.4% |
| South Africans | 92.3 /100 | #123 | Exceptional 11.4% |
| South American Indians | 92.2 /100 | #124 | Exceptional 11.4% |
| Costa Ricans | 91.9 /100 | #125 | Exceptional 11.4% |
| Immigrants | Latvia | 90.9 /100 | #126 | Exceptional 11.4% |
| Immigrants | Italy | 90.4 /100 | #127 | Exceptional 11.4% |
| Immigrants | Europe | 90.4 /100 | #128 | Exceptional 11.4% |
| Macedonians | 90.3 /100 | #129 | Exceptional 11.4% |
| Latvians | 89.8 /100 | #130 | Excellent 11.4% |
| Immigrants | Croatia | 89.8 /100 | #131 | Excellent 11.4% |
Demographics Similar to Immigrants from Burma/Myanmar by Disability
In terms of disability, the demographic groups most similar to Immigrants from Burma/Myanmar are Immigrants from Scotland (11.8%, a difference of 0.010%), Lebanese (11.8%, a difference of 0.030%), Iraqi (11.8%, a difference of 0.080%), Honduran (11.8%, a difference of 0.14%), and Immigrants from Mexico (11.9%, a difference of 0.27%).
| Demographics | Rating | Rank | Disability |
| Greeks | 46.2 /100 | #178 | Average 11.7% |
| Immigrants | Armenia | 41.9 /100 | #179 | Average 11.7% |
| Immigrants | Honduras | 37.8 /100 | #180 | Fair 11.8% |
| Immigrants | Oceania | 34.3 /100 | #181 | Fair 11.8% |
| Icelanders | 34.0 /100 | #182 | Fair 11.8% |
| Hondurans | 31.2 /100 | #183 | Fair 11.8% |
| Iraqis | 30.0 /100 | #184 | Fair 11.8% |
| Immigrants | Burma/Myanmar | 28.5 /100 | #185 | Fair 11.8% |
| Immigrants | Scotland | 28.2 /100 | #186 | Fair 11.8% |
| Lebanese | 27.9 /100 | #187 | Fair 11.8% |
| Immigrants | Mexico | 23.8 /100 | #188 | Fair 11.9% |
| Immigrants | Zaire | 21.8 /100 | #189 | Fair 11.9% |
| Immigrants | West Indies | 21.1 /100 | #190 | Fair 11.9% |
| Ute | 19.5 /100 | #191 | Poor 11.9% |
| Lithuanians | 18.8 /100 | #192 | Poor 11.9% |