South African vs Immigrants from Taiwan Disability Age 65 to 74
COMPARE
South African
Immigrants from Taiwan
Disability Age 65 to 74
Disability Age 65 to 74 Comparison
South Africans
Immigrants from Taiwan
21.9%
DISABILITY AGE 65 TO 74
98.4/ 100
METRIC RATING
86th/ 347
METRIC RANK
18.8%
DISABILITY AGE 65 TO 74
100.0/ 100
METRIC RATING
1st/ 347
METRIC RANK
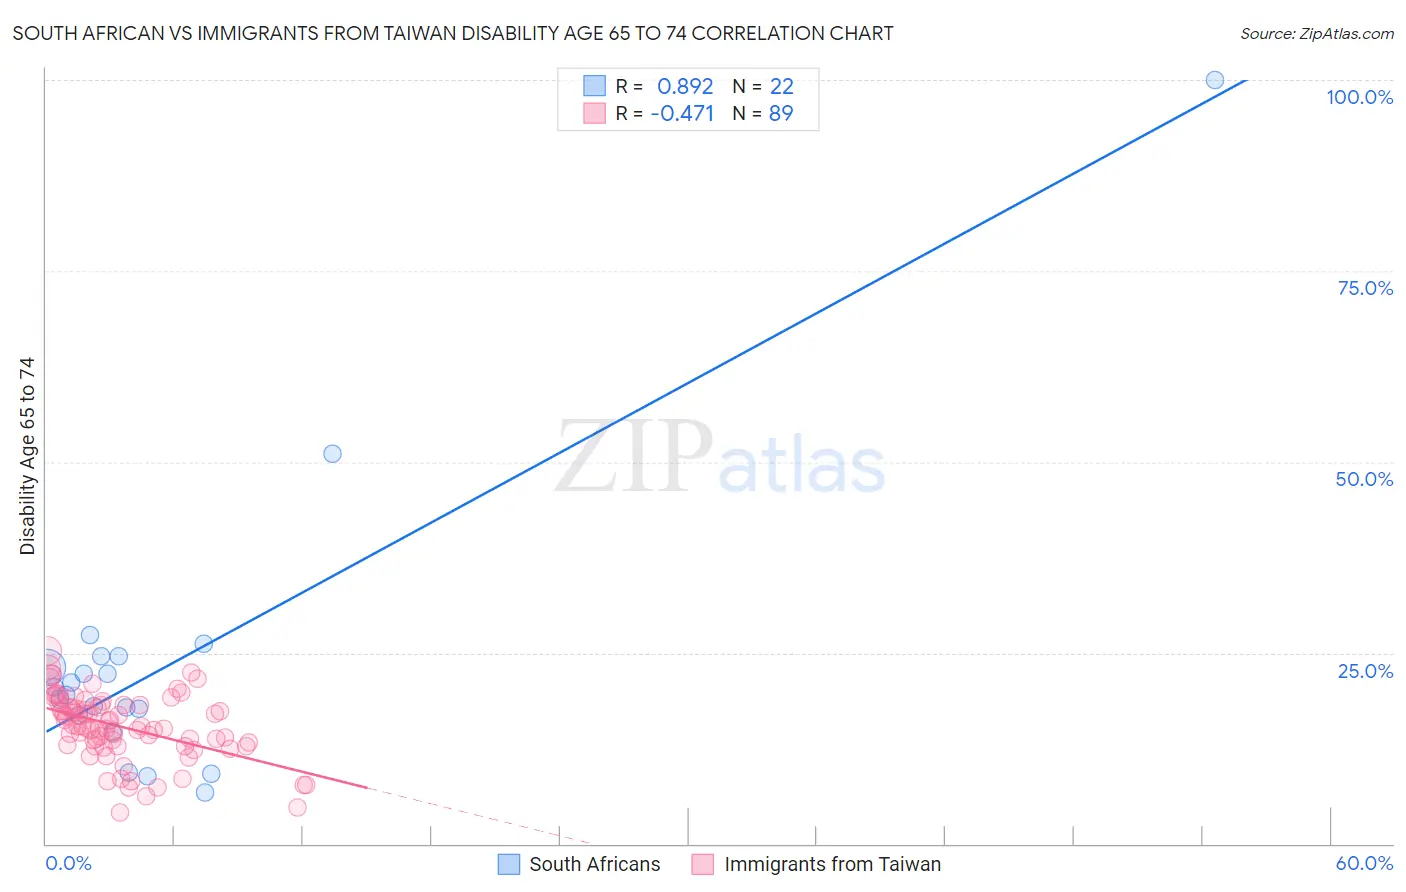
South African vs Immigrants from Taiwan Disability Age 65 to 74 Correlation Chart
The statistical analysis conducted on geographies consisting of 182,352,793 people shows a very strong positive correlation between the proportion of South Africans and percentage of population with a disability between the ages 65 and 75 in the United States with a correlation coefficient (R) of 0.892 and weighted average of 21.9%. Similarly, the statistical analysis conducted on geographies consisting of 297,907,206 people shows a moderate negative correlation between the proportion of Immigrants from Taiwan and percentage of population with a disability between the ages 65 and 75 in the United States with a correlation coefficient (R) of -0.471 and weighted average of 18.8%, a difference of 16.9%.
Disability Age 65 to 74 Correlation Summary
| Measurement | South African | Immigrants from Taiwan |
| Minimum | 6.7% | 4.1% |
| Maximum | 100.0% | 25.2% |
| Range | 93.3% | 21.2% |
| Mean | 23.6% | 15.3% |
| Median | 20.0% | 15.4% |
| Interquartile 25% (IQ1) | 16.9% | 12.9% |
| Interquartile 75% (IQ3) | 24.5% | 18.2% |
| Interquartile Range (IQR) | 7.6% | 5.3% |
| Standard Deviation (Sample) | 19.3% | 4.3% |
| Standard Deviation (Population) | 18.8% | 4.3% |
Similar Demographics by Disability Age 65 to 74
Demographics Similar to South Africans by Disability Age 65 to 74
In terms of disability age 65 to 74, the demographic groups most similar to South Africans are Immigrants from Lebanon (21.9%, a difference of 0.080%), Immigrants from Spain (21.9%, a difference of 0.18%), Immigrants from Brazil (21.9%, a difference of 0.20%), Australian (22.0%, a difference of 0.34%), and Immigrants from Netherlands (22.0%, a difference of 0.35%).
| Demographics | Rating | Rank | Disability Age 65 to 74 |
| Venezuelans | 99.0 /100 | #79 | Exceptional 21.8% |
| Immigrants | Norway | 98.9 /100 | #80 | Exceptional 21.8% |
| Croatians | 98.9 /100 | #81 | Exceptional 21.8% |
| Immigrants | Indonesia | 98.7 /100 | #82 | Exceptional 21.9% |
| Immigrants | Brazil | 98.5 /100 | #83 | Exceptional 21.9% |
| Immigrants | Spain | 98.5 /100 | #84 | Exceptional 21.9% |
| Immigrants | Lebanon | 98.4 /100 | #85 | Exceptional 21.9% |
| South Africans | 98.4 /100 | #86 | Exceptional 21.9% |
| Australians | 98.0 /100 | #87 | Exceptional 22.0% |
| Immigrants | Netherlands | 97.9 /100 | #88 | Exceptional 22.0% |
| Immigrants | Kuwait | 97.9 /100 | #89 | Exceptional 22.0% |
| Italians | 97.9 /100 | #90 | Exceptional 22.0% |
| Chileans | 97.9 /100 | #91 | Exceptional 22.0% |
| Poles | 97.8 /100 | #92 | Exceptional 22.0% |
| Immigrants | Canada | 97.8 /100 | #93 | Exceptional 22.1% |
Demographics Similar to Immigrants from Taiwan by Disability Age 65 to 74
In terms of disability age 65 to 74, the demographic groups most similar to Immigrants from Taiwan are Filipino (19.0%, a difference of 1.2%), Immigrants from India (19.7%, a difference of 4.9%), Immigrants from Hong Kong (19.9%, a difference of 5.8%), Immigrants from Israel (19.9%, a difference of 6.1%), and Iranian (19.9%, a difference of 6.2%).
| Demographics | Rating | Rank | Disability Age 65 to 74 |
| Immigrants | Taiwan | 100.0 /100 | #1 | Exceptional 18.8% |
| Filipinos | 100.0 /100 | #2 | Exceptional 19.0% |
| Immigrants | India | 100.0 /100 | #3 | Exceptional 19.7% |
| Immigrants | Hong Kong | 100.0 /100 | #4 | Exceptional 19.9% |
| Immigrants | Israel | 100.0 /100 | #5 | Exceptional 19.9% |
| Iranians | 100.0 /100 | #6 | Exceptional 19.9% |
| Cypriots | 100.0 /100 | #7 | Exceptional 20.1% |
| Thais | 100.0 /100 | #8 | Exceptional 20.1% |
| Immigrants | China | 100.0 /100 | #9 | Exceptional 20.3% |
| Immigrants | Eastern Asia | 100.0 /100 | #10 | Exceptional 20.3% |
| Immigrants | Ireland | 100.0 /100 | #11 | Exceptional 20.3% |
| Immigrants | Korea | 100.0 /100 | #12 | Exceptional 20.4% |
| Immigrants | Singapore | 100.0 /100 | #13 | Exceptional 20.4% |
| Indians (Asian) | 100.0 /100 | #14 | Exceptional 20.5% |
| Paraguayans | 100.0 /100 | #15 | Exceptional 20.5% |