Immigrants from Nepal vs Immigrants from Taiwan Disability Age 65 to 74
COMPARE
Immigrants from Nepal
Immigrants from Taiwan
Disability Age 65 to 74
Disability Age 65 to 74 Comparison
Immigrants from Nepal
Immigrants from Taiwan
22.6%
DISABILITY AGE 65 TO 74
89.4/ 100
METRIC RATING
131st/ 347
METRIC RANK
18.8%
DISABILITY AGE 65 TO 74
100.0/ 100
METRIC RATING
1st/ 347
METRIC RANK
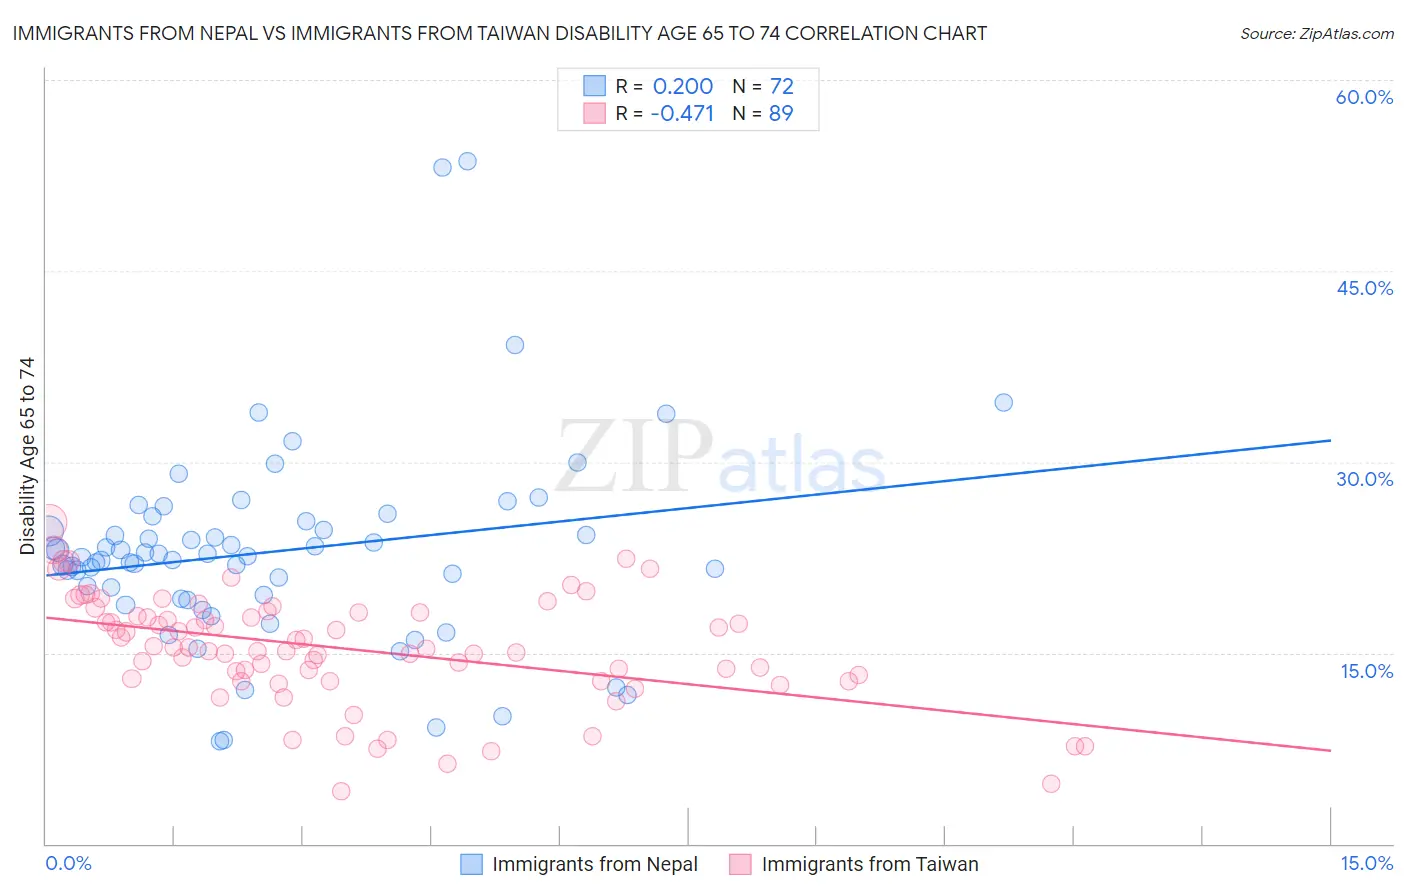
Immigrants from Nepal vs Immigrants from Taiwan Disability Age 65 to 74 Correlation Chart
The statistical analysis conducted on geographies consisting of 186,541,016 people shows a weak positive correlation between the proportion of Immigrants from Nepal and percentage of population with a disability between the ages 65 and 75 in the United States with a correlation coefficient (R) of 0.200 and weighted average of 22.6%. Similarly, the statistical analysis conducted on geographies consisting of 297,907,206 people shows a moderate negative correlation between the proportion of Immigrants from Taiwan and percentage of population with a disability between the ages 65 and 75 in the United States with a correlation coefficient (R) of -0.471 and weighted average of 18.8%, a difference of 20.5%.
Disability Age 65 to 74 Correlation Summary
| Measurement | Immigrants from Nepal | Immigrants from Taiwan |
| Minimum | 8.0% | 4.1% |
| Maximum | 53.6% | 25.2% |
| Range | 45.6% | 21.2% |
| Mean | 22.9% | 15.3% |
| Median | 22.6% | 15.4% |
| Interquartile 25% (IQ1) | 19.4% | 12.9% |
| Interquartile 75% (IQ3) | 25.0% | 18.2% |
| Interquartile Range (IQR) | 5.6% | 5.3% |
| Standard Deviation (Sample) | 7.9% | 4.3% |
| Standard Deviation (Population) | 7.8% | 4.3% |
Similar Demographics by Disability Age 65 to 74
Demographics Similar to Immigrants from Nepal by Disability Age 65 to 74
In terms of disability age 65 to 74, the demographic groups most similar to Immigrants from Nepal are Costa Rican (22.6%, a difference of 0.040%), Northern European (22.6%, a difference of 0.080%), Immigrants from Albania (22.6%, a difference of 0.090%), Immigrants from Uruguay (22.6%, a difference of 0.10%), and Afghan (22.6%, a difference of 0.13%).
| Demographics | Rating | Rank | Disability Age 65 to 74 |
| Norwegians | 92.5 /100 | #124 | Exceptional 22.5% |
| Immigrants | Western Europe | 92.3 /100 | #125 | Exceptional 22.5% |
| Lebanese | 92.2 /100 | #126 | Exceptional 22.5% |
| Slovaks | 91.6 /100 | #127 | Exceptional 22.5% |
| Immigrants | Costa Rica | 90.4 /100 | #128 | Exceptional 22.6% |
| Immigrants | Uruguay | 90.1 /100 | #129 | Exceptional 22.6% |
| Immigrants | Albania | 90.0 /100 | #130 | Excellent 22.6% |
| Immigrants | Nepal | 89.4 /100 | #131 | Excellent 22.6% |
| Costa Ricans | 89.2 /100 | #132 | Excellent 22.6% |
| Northern Europeans | 88.9 /100 | #133 | Excellent 22.6% |
| Afghans | 88.6 /100 | #134 | Excellent 22.6% |
| Immigrants | Ukraine | 88.4 /100 | #135 | Excellent 22.6% |
| Ethiopians | 87.9 /100 | #136 | Excellent 22.7% |
| Taiwanese | 87.6 /100 | #137 | Excellent 22.7% |
| Immigrants | Moldova | 87.3 /100 | #138 | Excellent 22.7% |
Demographics Similar to Immigrants from Taiwan by Disability Age 65 to 74
In terms of disability age 65 to 74, the demographic groups most similar to Immigrants from Taiwan are Filipino (19.0%, a difference of 1.2%), Immigrants from India (19.7%, a difference of 4.9%), Immigrants from Hong Kong (19.9%, a difference of 5.8%), Immigrants from Israel (19.9%, a difference of 6.1%), and Iranian (19.9%, a difference of 6.2%).
| Demographics | Rating | Rank | Disability Age 65 to 74 |
| Immigrants | Taiwan | 100.0 /100 | #1 | Exceptional 18.8% |
| Filipinos | 100.0 /100 | #2 | Exceptional 19.0% |
| Immigrants | India | 100.0 /100 | #3 | Exceptional 19.7% |
| Immigrants | Hong Kong | 100.0 /100 | #4 | Exceptional 19.9% |
| Immigrants | Israel | 100.0 /100 | #5 | Exceptional 19.9% |
| Iranians | 100.0 /100 | #6 | Exceptional 19.9% |
| Cypriots | 100.0 /100 | #7 | Exceptional 20.1% |
| Thais | 100.0 /100 | #8 | Exceptional 20.1% |
| Immigrants | China | 100.0 /100 | #9 | Exceptional 20.3% |
| Immigrants | Eastern Asia | 100.0 /100 | #10 | Exceptional 20.3% |
| Immigrants | Ireland | 100.0 /100 | #11 | Exceptional 20.3% |
| Immigrants | Korea | 100.0 /100 | #12 | Exceptional 20.4% |
| Immigrants | Singapore | 100.0 /100 | #13 | Exceptional 20.4% |
| Indians (Asian) | 100.0 /100 | #14 | Exceptional 20.5% |
| Paraguayans | 100.0 /100 | #15 | Exceptional 20.5% |